QUESTION IMAGE
Question
the point (4, 10) is in each scatterplot. in which one is it an outlier?
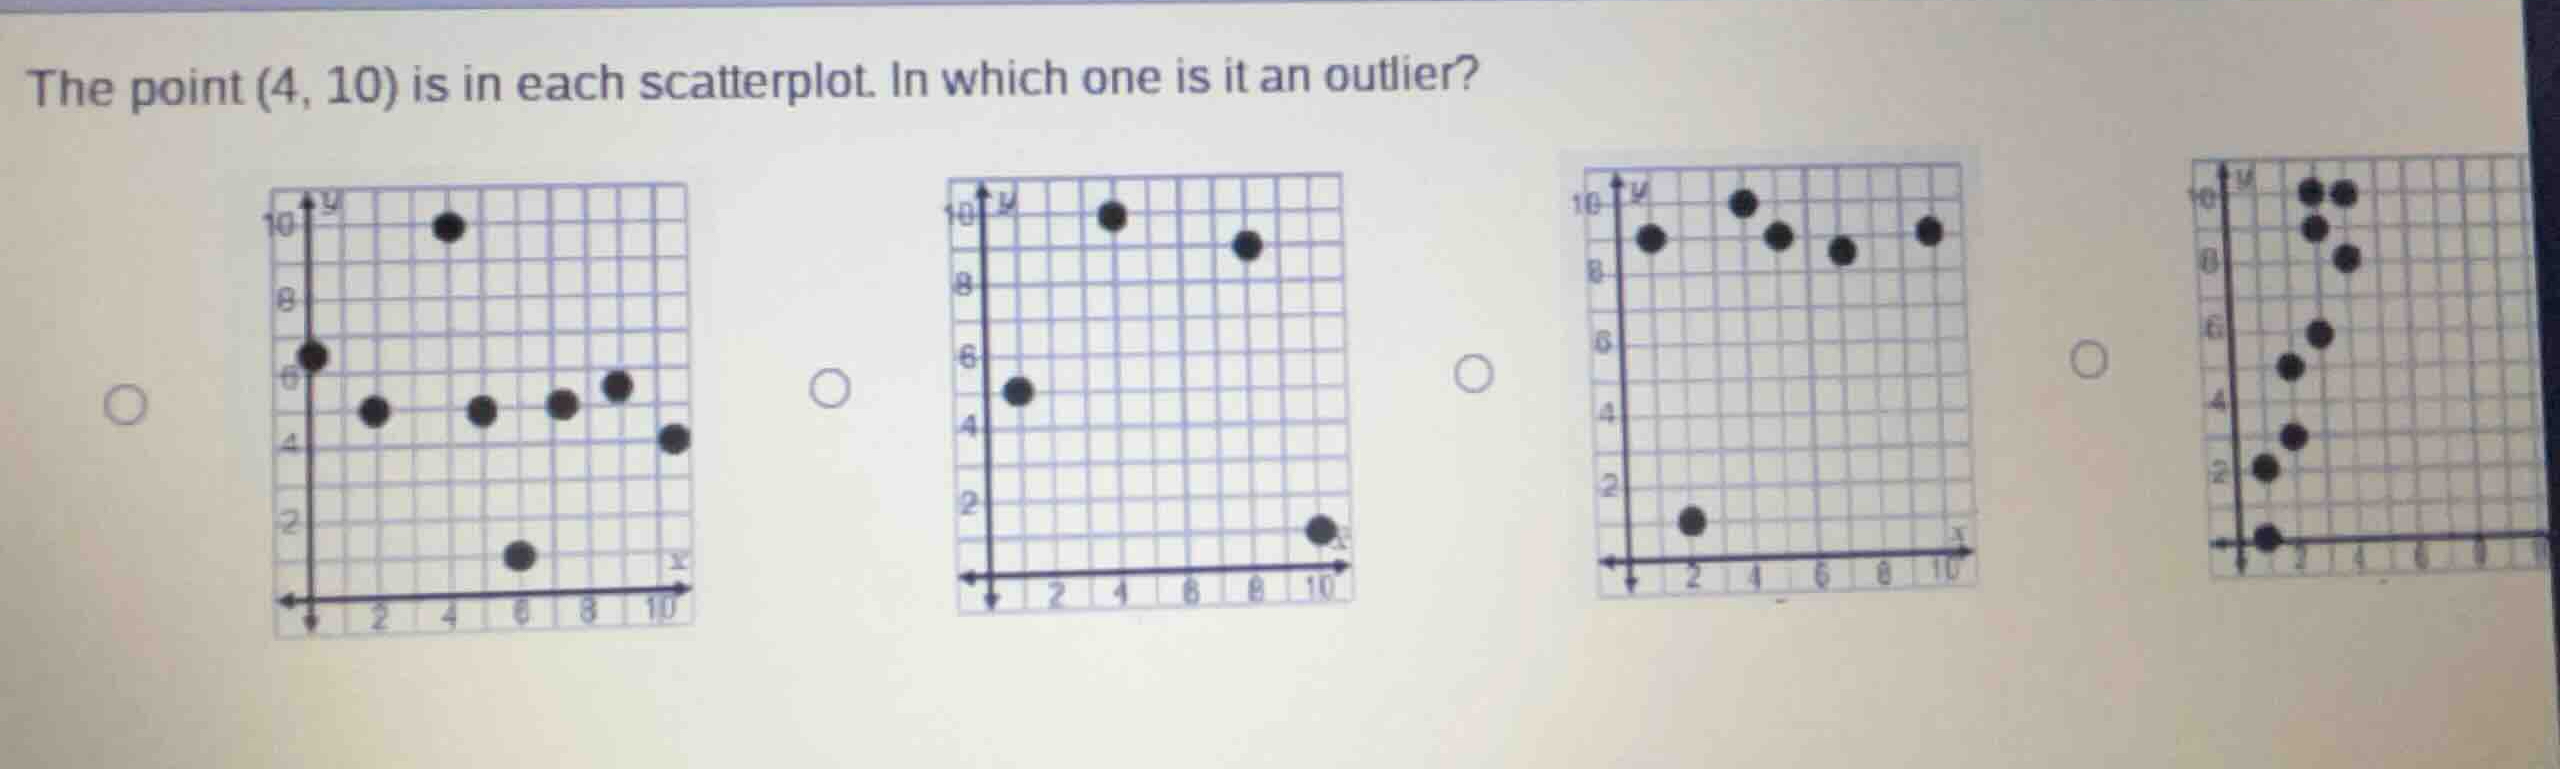
Identify the position of the point (4, 10) in each scatterplot
In all four scatterplots, the point \( (4, 10) \) is plotted. We locate \( x = 4 \) on the horizontal axis and \( y = 10 \) on the vertical axis to find this point.
Analyze the pattern of the remaining data points in each option
- First scatterplot: Most points lie in a horizontal band around \( y = 5 \). The point \( (4, 10) \) is far above this main cluster of data, making it a clear outlier.
- Second scatterplot: There are only four points total, widely dispersed, with \( (4, 10) \) being one of the main data points defining the downward trend.
- Third scatterplot: Most points lie in a high horizontal band around \( y = 9 \) or \( y = 10 \). The point \( (4, 10) \) is part of this main group.
- Fourth scatterplot: The points show a strong positive, nearly vertical trend where \( y \) increases rapidly as \( x \) goes from 0 to 3. The point \( (4, 10) \) lies directly along this steep upward trend line.
Determine which scatterplot shows (4, 10) as an outlier
An outlier is a data point that deviates significantly from the overall pattern of the rest of the data. In the first scatterplot, the overall pattern is a horizontal cluster around \( y = 5 \), and \( (4, 10) \) lies completely outside this pattern.

Snap & solve any problem in the app
Get step-by-step solutions on Sovi AI
Photo-based solutions with guided steps
Explore more problems and detailed explanations
- (A) The first scatterplot, where most points cluster horizontally around \(y = 5\) and the point \((4, 10)\) is isolated far above them. (Correct answer)
- (B) The second scatterplot, which contains widely dispersed points showing a downward trend.
- (C) The third scatterplot, where most points are clustered near the top around \(y = 9\) and \(y = 10\).
- (D) The fourth scatterplot, where the points follow a steep upward trend that includes \((4, 10)\).