QUESTION IMAGE
Question
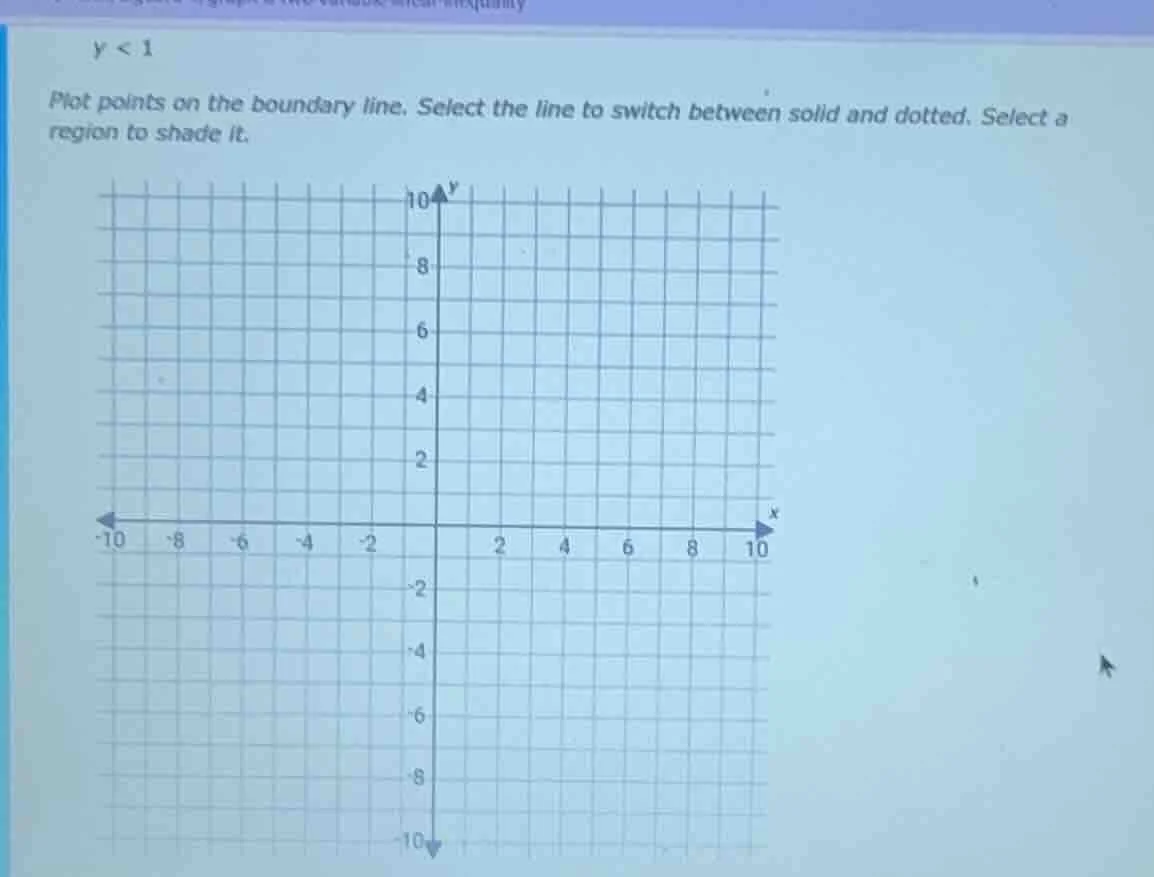
y < 1
plot points on the boundary line. select the line to switch between solid and dotted. select a region to shade it.
Step1: Identify the boundary line
The inequality is \( y < 1 \). The boundary line is \( y = 1 \), which is a horizontal line parallel to the x - axis passing through \( y = 1 \). Since the inequality is strict (\( < \) and not \( \leq \)), the boundary line should be a dotted line.
Step2: Determine the region to shade
We need to find the region where \( y \) - values are less than 1. For a horizontal line \( y = k \), the region \( y < k \) is the region below the line. So, we shade the region below the dotted line \( y = 1 \).
To plot the boundary line (dotted line \( y = 1 \)):
- We can plot points like \((0,1)\), \((1,1)\), \(( - 1,1)\) etc. (any point with \( y = 1 \)) and draw a dotted line through them.
- Then shade the area below this dotted line (where \( y<1 \)).

Snap & solve any problem in the app
Get step-by-step solutions on Sovi AI
Photo-based solutions with guided steps
Explore more problems and detailed explanations
The boundary line is a dotted horizontal line \( y = 1 \), and the region below this line (where \( y < 1 \)) is shaded.