QUESTION IMAGE
Question
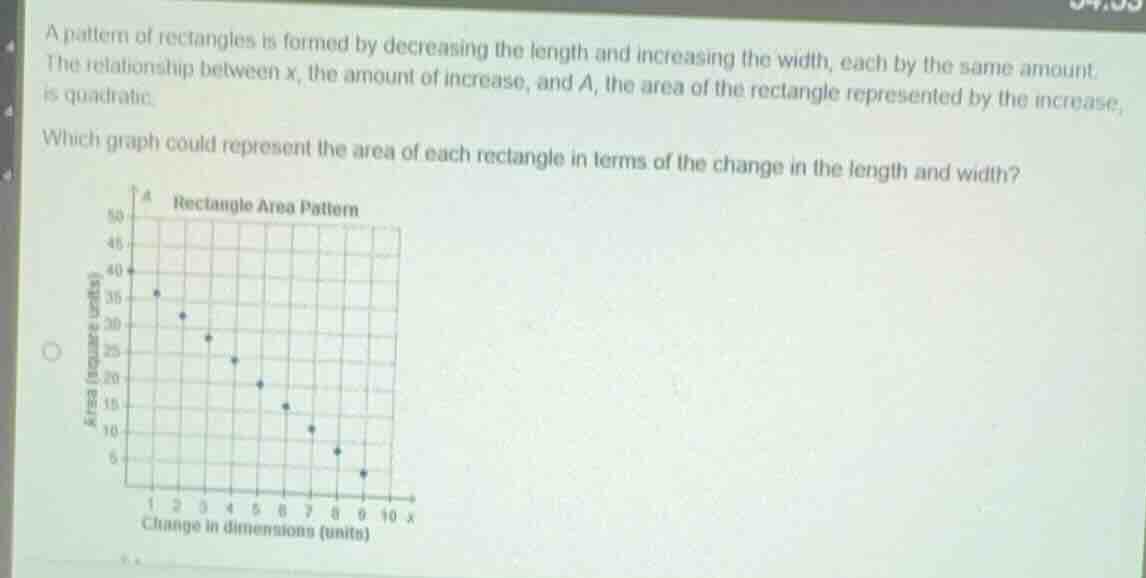
a pattern of rectangles is formed by decreasing the length and increasing the width, each by the same amount. the relationship between x, the amount of increase, and a, the area of the rectangle represented by the increase, is quadratic.
which graph could represent the area of each rectangle in terms of the change in the length and width?
Model the area function
Using the Quadratic Modeling Interpretation knowledge point
Let the initial length of the rectangle be \(L\) and the initial width be \(W\).
The length is decreased by \(x\) and the width is increased by \(x\).
The new dimensions are:
The area \(A(x)\) is given by:
Analyze the quadratic graph properties
Using the Quadratic Modeling Interpretation knowledge point
The leading coefficient of \(A(x) = -x^2 + (L - W)x + LW\) is negative (\(-1\)).
Therefore, the parabola opens downwards, representing a curve that increases to a maximum value and then decreases.
Evaluate the given graph
Using the Quadratic Modeling Interpretation knowledge point
The provided graph shows points that continuously decrease as \(x\) increases from \(1\) to \(9\).
Specifically, the points are:
These points lie on a straight line with a constant slope of \(-4\), which represents a linear relationship, not a quadratic one.
Thus, the shown graph does not represent the quadratic relationship described.
A correct graph representing the quadratic area must be a downward-opening parabola (curved path).

Snap & solve any problem in the app
Get step-by-step solutions on Sovi AI
Photo-based solutions with guided steps
Explore more problems and detailed explanations
The graph shown in the image does not represent the quadratic relationship because the plotted points lie on a straight line, indicating a linear relationship.
A graph that could represent the area of each rectangle in terms of the change in dimensions must be a downward-opening parabola (curved path) reflecting the quadratic function: