QUESTION IMAGE
Question
passage one passage two systems.
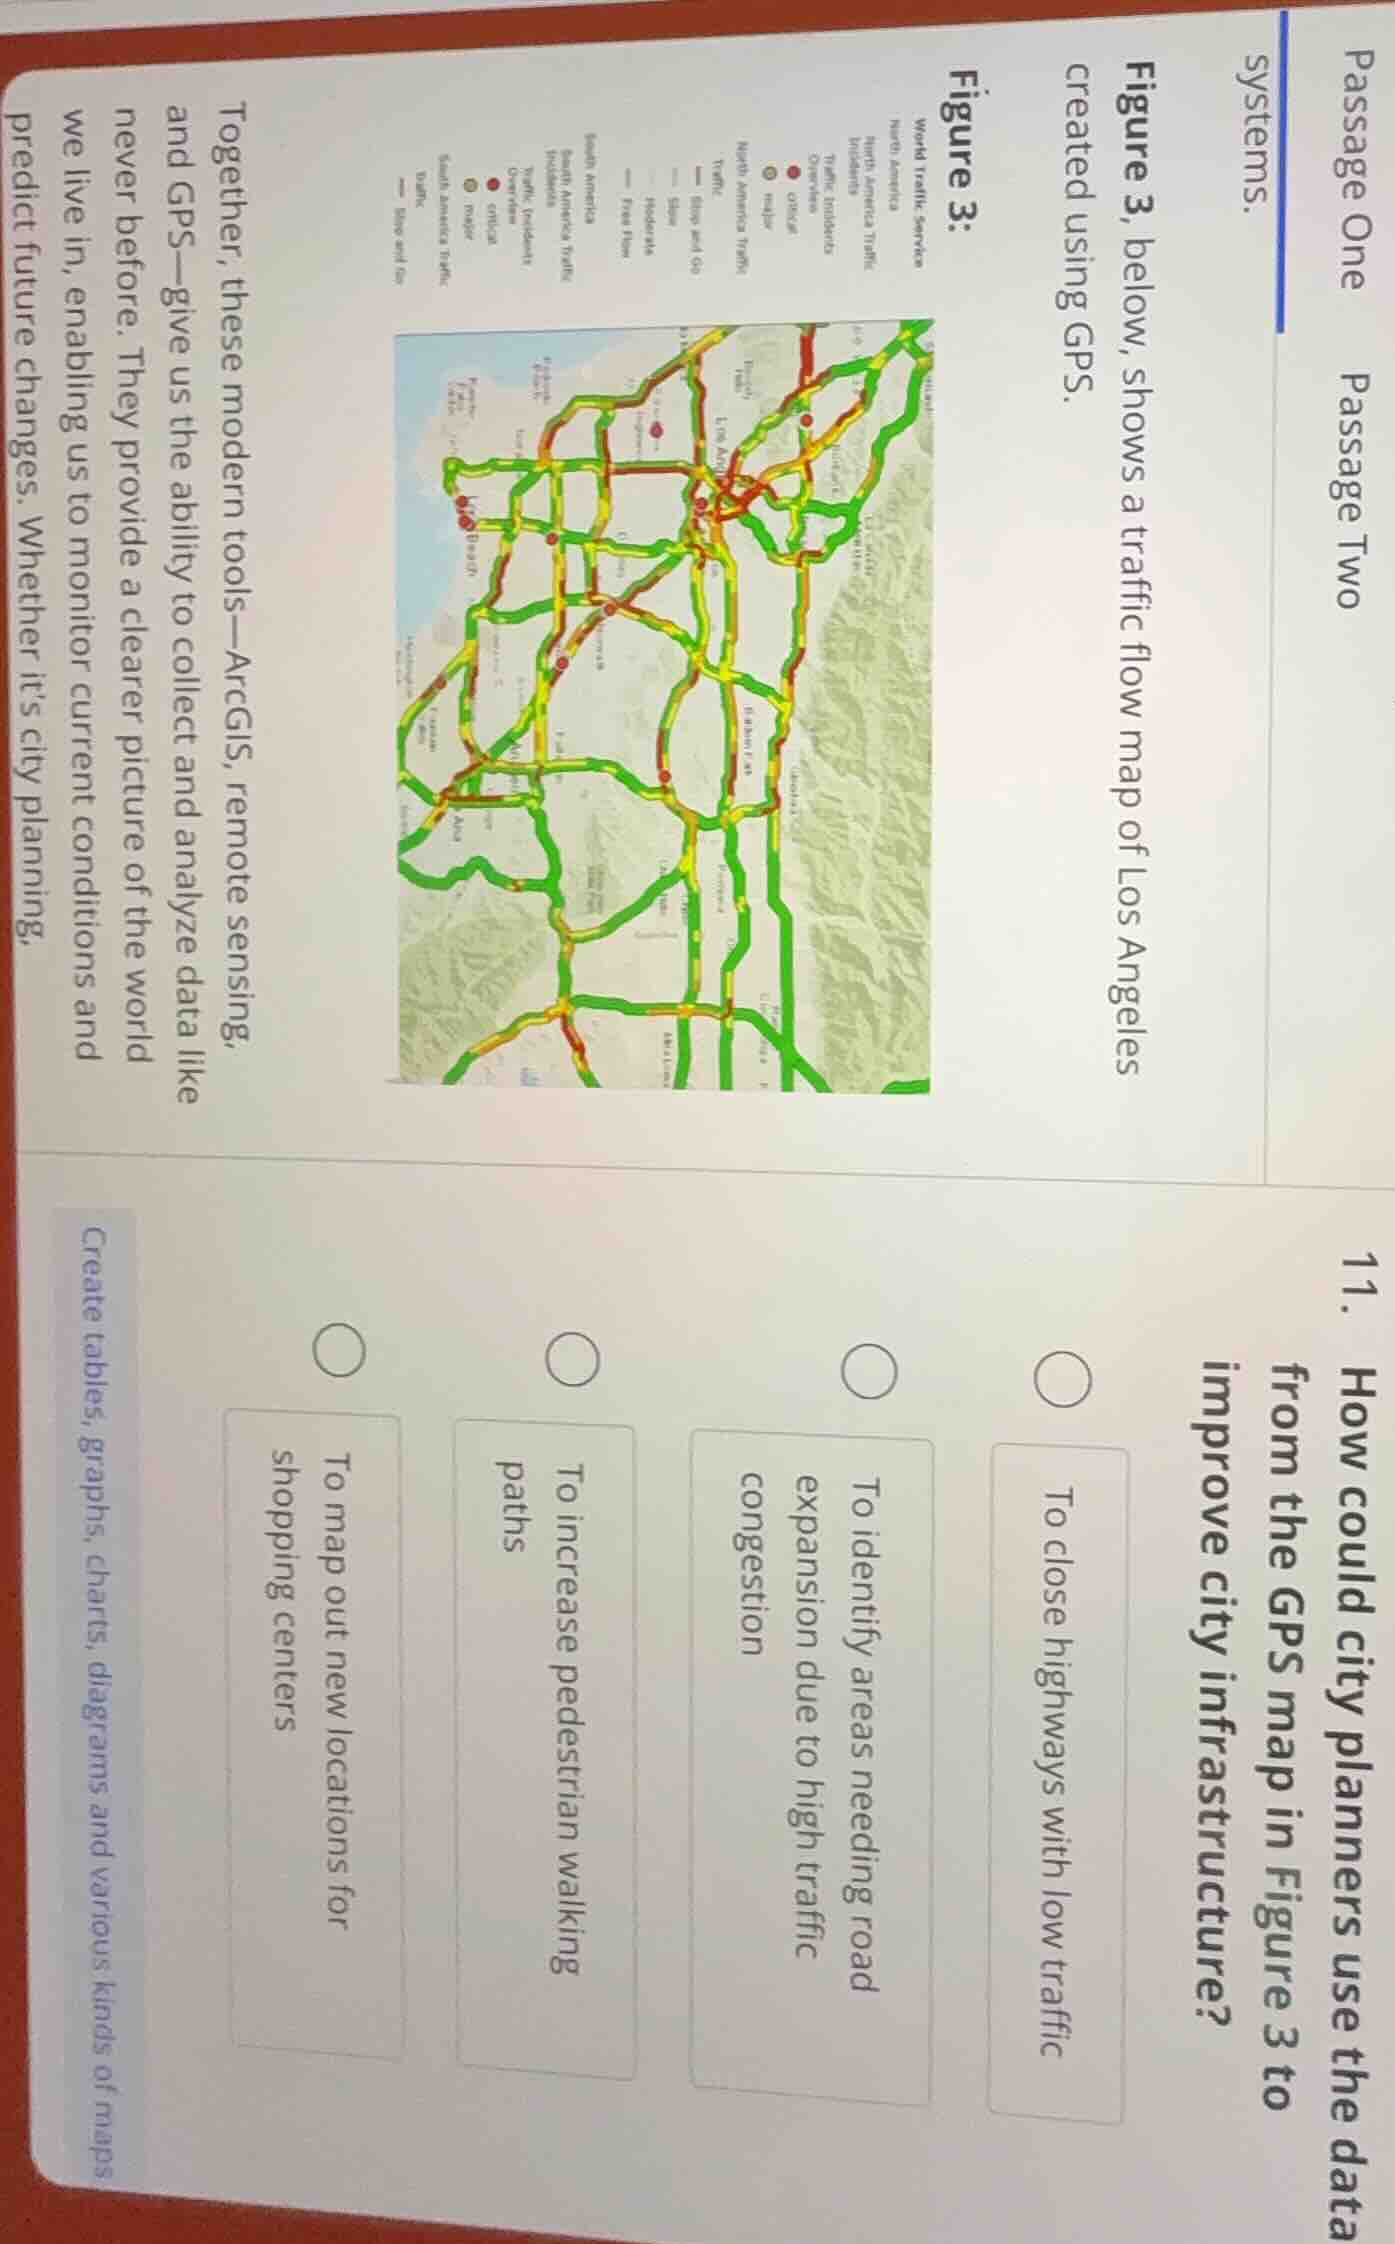
figure 3, below, shows a traffic flow map of los angeles created using gps.
figure 3:
world traffic service
north america traffic
traffic incidents
one view
ongle
north america traffic
traffic
slow and go
incidents
free flow
north america traffic
south america traffic
north america traffic
south america traffic
truck
together, these modern tools—arcgis, remote sensing, and gps—give us the ability to collect and analyze data like never before. they provide a clearer picture of the world we live in, enabling us to monitor current conditions and predict future changes. whether it’s city planning,
- how could city planners use the data from the gps map in figure 3 to improve city infrastructure?
○ to close highways with low traffic
○ to identify areas needing road expansion due to high traffic congestion
○ to increase pedestrian walking paths
○ to map out new locations for shopping centers
create tables, graphs, charts, diagrams and various kinds of maps
The GPS traffic map shows areas of high congestion (red lines) and free flow (green lines). City planners use this data to target infrastructure improvements. Closing low-traffic highways is not a logical improvement. Increasing pedestrian paths is unrelated to highway traffic data. Mapping shopping centers is not tied to infrastructure improvement from traffic flow data. Identifying congested areas to plan road expansions directly addresses infrastructure needs using the map's traffic data.

Snap & solve any problem in the app
Get step-by-step solutions on Sovi AI
Photo-based solutions with guided steps
Explore more problems and detailed explanations
To identify areas needing road expansion due to high traffic congestion