QUESTION IMAGE
Question
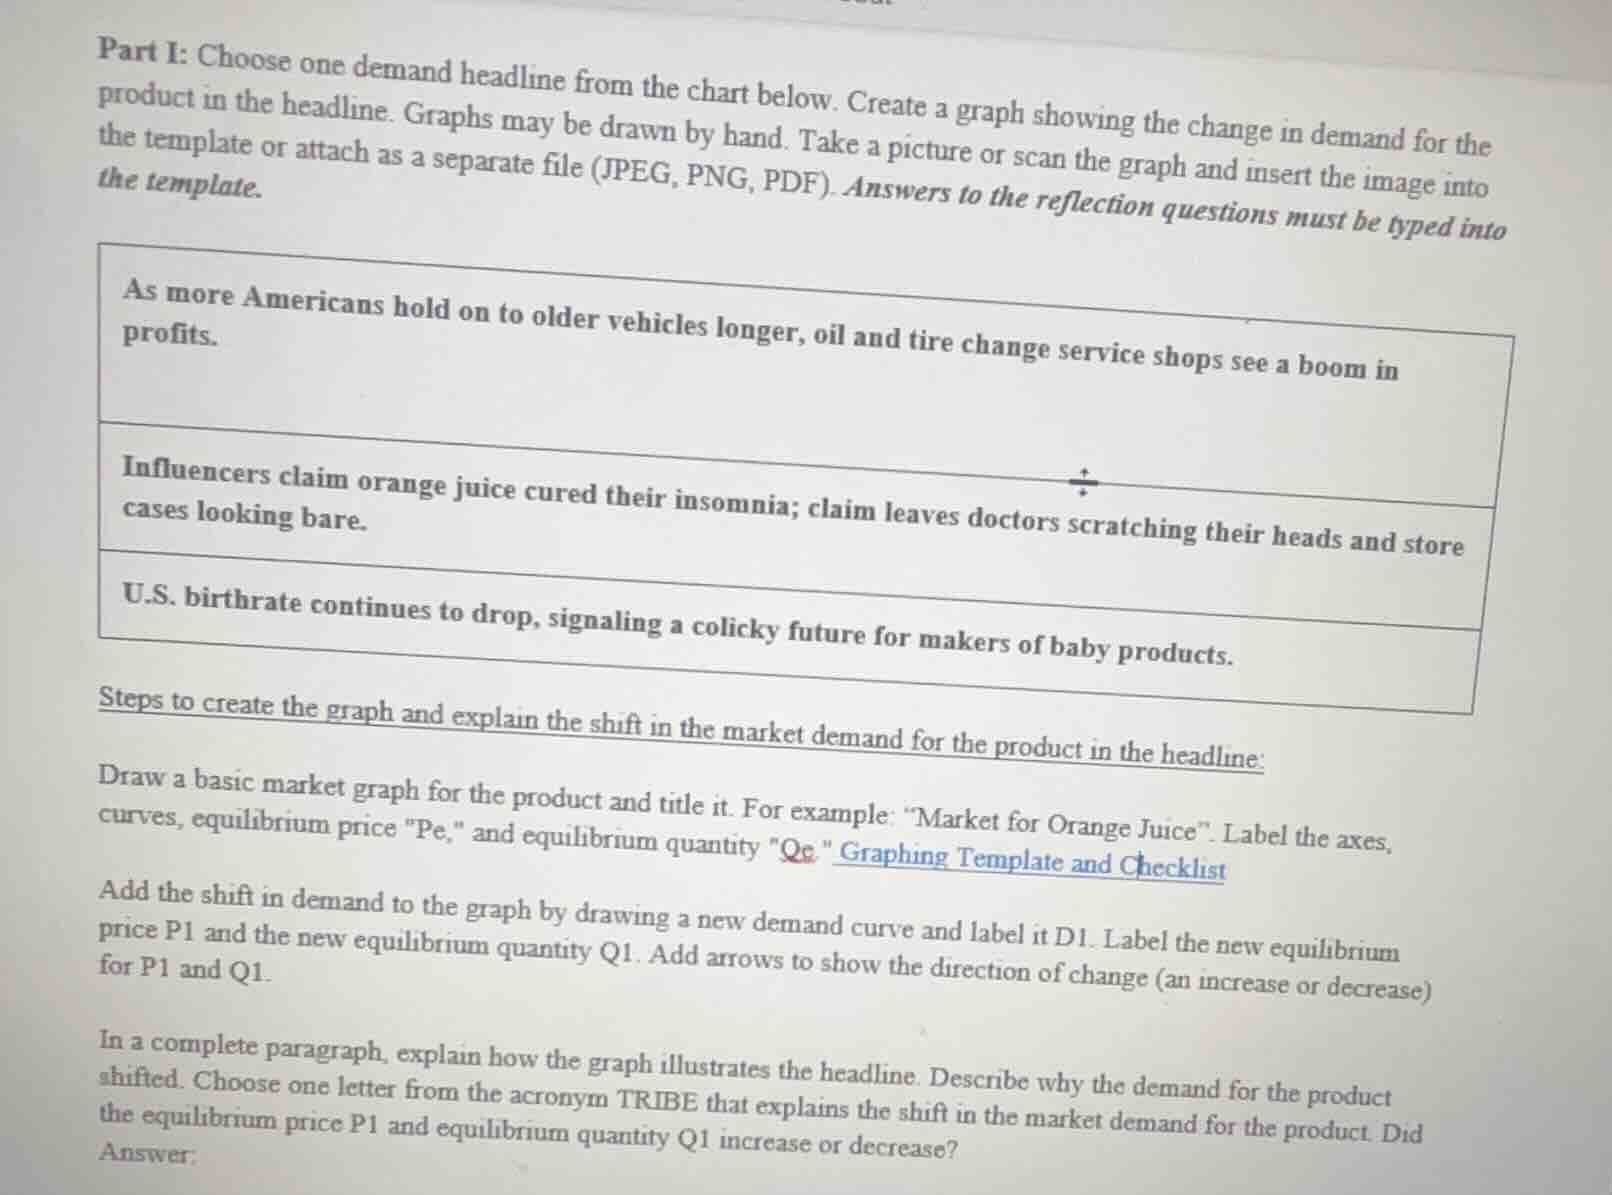
part i: choose one demand headline from the chart below. create a graph showing the change in demand for the product in the headline. graphs may be drawn by hand. take a picture or scan the graph and insert the image into the template or attach as a separate file (jpeg, png, pdf). answers to the reflection questions must be typed into the template.
as more americans hold on to older vehicles longer, oil and tire change service shops see a boom in profits.
influencers claim orange juice cured their insomnia; claim leaves doctors scratching their heads and store cases looking bare.
u.s. birthrate continues to drop, signaling a colicky future for makers of baby products.
steps to create the graph and explain the shift in the market demand for the product in the headline:
draw a basic market graph for the product and title it. for example: \market for orange juice\. label the axes, curves, equilibrium price \pe,\ and equilibrium quantity \qe.\ graphing template and checklist
add the shift in demand to the graph by drawing a new demand curve and label it d1. label the new equilibrium price p1 and the new equilibrium quantity q1. add arrows to show the direction of change (an increase or decrease) for p1 and q1.
in a complete paragraph, explain how the graph illustrates the headline. describe why the demand for the product shifted. choose one letter from the acronym tribe that explains the shift in the market demand for the product. did the equilibrium price p1 and equilibrium quantity q1 increase or decrease?
answer:
To solve this problem, we'll choose the headline about orange juice and follow the steps to create the graph and explain the demand shift.
Step 1: Choose the Headline
We'll use the headline: "Influencers claim orange juice cured their insomnia; claim leaves doctors scratching their heads and store cases looking bare." This headline suggests an increase in demand for orange juice due to the influencer claims (a change in consumer tastes/preferences).
Step 2: Draw the Basic Market Graph
- Title: "Market for Orange Juice"
- Axes:
- Vertical (Y) Axis: Label "Price (P)" (measured in dollars per unit, e.g., per carton).
- Horizontal (X) Axis: Label "Quantity (Q)" (measured in number of cartons or units).
- Curves:
- Draw the original demand curve (D) as a downward - sloping line.
- Draw the original supply curve (S) as an upward - sloping line.
- Equilibrium:
- The intersection of D and S is the original equilibrium. Label the equilibrium price as \( P_e \) and the equilibrium quantity as \( Q_e \).
Step 3: Add the Demand Shift
- Since the influencer claims are likely to increase consumer interest in orange juice (a change in tastes), the demand for orange juice will increase.
- Draw a new demand curve (D₁) to the right of the original demand curve (D).
- The new equilibrium is at the intersection of D₁ and S. Label the new equilibrium price as \( P_1 \) and the new equilibrium quantity as \( Q_1 \).
- Add arrows:
- For the price: An arrow pointing up from \( P_e \) to \( P_1 \) to show the increase in price.
- For the quantity: An arrow pointing to the right from \( Q_e \) to \( Q_1 \) to show the increase in quantity.
Step 4: Explain the Graph and Demand Shift
- Graph Illustration: The original demand curve (D) and supply curve (S) intersect at \( P_e \) and \( Q_e \), representing the initial equilibrium in the orange juice market. When influencers claim that orange juice can cure insomnia, consumer tastes and preferences shift in favor of orange juice. This causes the demand curve to shift to the right (from D to D₁). The new intersection of D₁ and S gives the new equilibrium with a higher price (\( P_1 \)) and a higher quantity (\( Q_1 \)).
- TRIBE Explanation: We use the "T" from TRIBE, which stands for "Tastes and Preferences". The influencer claims about the health benefits (curing insomnia) of orange juice change consumers' tastes and preferences, making them more willing to buy orange juice at each price level. This increases the demand for orange juice.
- Equilibrium Changes: The equilibrium price (\( P_1 \)) increases compared to \( P_e \), and the equilibrium quantity (\( Q_1 \)) also increases compared to \( Q_e \).
Reflection Questions (Sample Answers)
- How does the graph illustrate the headline?
The graph shows that when influencers made claims about orange juice curing insomnia, the demand for orange juice increased (shift of D to D₁). This increase in demand led to a higher equilibrium price (\( P_1 \)) and a higher equilibrium quantity (\( Q_1 \)). The "store cases looking bare" in the headline is consistent with the increase in quantity demanded, as more consumers are buying orange juice, potentially leading to shortages on store shelves if supply can't immediately keep up with the increased demand.
- Why did the demand shift?
The demand shifted because of a change in consumer tastes and preferences (the "T" in TRIBE). The influencer claims about the supposed health benefits of orange juice (curing insomnia) made consumers more interested in…

Snap & solve any problem in the app
Get step-by-step solutions on Sovi AI
Photo-based solutions with guided steps
Explore more problems and detailed explanations
To solve this problem, we'll choose the headline about orange juice and follow the steps to create the graph and explain the demand shift.
Step 1: Choose the Headline
We'll use the headline: "Influencers claim orange juice cured their insomnia; claim leaves doctors scratching their heads and store cases looking bare." This headline suggests an increase in demand for orange juice due to the influencer claims (a change in consumer tastes/preferences).
Step 2: Draw the Basic Market Graph
- Title: "Market for Orange Juice"
- Axes:
- Vertical (Y) Axis: Label "Price (P)" (measured in dollars per unit, e.g., per carton).
- Horizontal (X) Axis: Label "Quantity (Q)" (measured in number of cartons or units).
- Curves:
- Draw the original demand curve (D) as a downward - sloping line.
- Draw the original supply curve (S) as an upward - sloping line.
- Equilibrium:
- The intersection of D and S is the original equilibrium. Label the equilibrium price as \( P_e \) and the equilibrium quantity as \( Q_e \).
Step 3: Add the Demand Shift
- Since the influencer claims are likely to increase consumer interest in orange juice (a change in tastes), the demand for orange juice will increase.
- Draw a new demand curve (D₁) to the right of the original demand curve (D).
- The new equilibrium is at the intersection of D₁ and S. Label the new equilibrium price as \( P_1 \) and the new equilibrium quantity as \( Q_1 \).
- Add arrows:
- For the price: An arrow pointing up from \( P_e \) to \( P_1 \) to show the increase in price.
- For the quantity: An arrow pointing to the right from \( Q_e \) to \( Q_1 \) to show the increase in quantity.
Step 4: Explain the Graph and Demand Shift
- Graph Illustration: The original demand curve (D) and supply curve (S) intersect at \( P_e \) and \( Q_e \), representing the initial equilibrium in the orange juice market. When influencers claim that orange juice can cure insomnia, consumer tastes and preferences shift in favor of orange juice. This causes the demand curve to shift to the right (from D to D₁). The new intersection of D₁ and S gives the new equilibrium with a higher price (\( P_1 \)) and a higher quantity (\( Q_1 \)).
- TRIBE Explanation: We use the "T" from TRIBE, which stands for "Tastes and Preferences". The influencer claims about the health benefits (curing insomnia) of orange juice change consumers' tastes and preferences, making them more willing to buy orange juice at each price level. This increases the demand for orange juice.
- Equilibrium Changes: The equilibrium price (\( P_1 \)) increases compared to \( P_e \), and the equilibrium quantity (\( Q_1 \)) also increases compared to \( Q_e \).
Reflection Questions (Sample Answers)
- How does the graph illustrate the headline?
The graph shows that when influencers made claims about orange juice curing insomnia, the demand for orange juice increased (shift of D to D₁). This increase in demand led to a higher equilibrium price (\( P_1 \)) and a higher equilibrium quantity (\( Q_1 \)). The "store cases looking bare" in the headline is consistent with the increase in quantity demanded, as more consumers are buying orange juice, potentially leading to shortages on store shelves if supply can't immediately keep up with the increased demand.
- Why did the demand shift?
The demand shifted because of a change in consumer tastes and preferences (the "T" in TRIBE). The influencer claims about the supposed health benefits of orange juice (curing insomnia) made consumers more interested in purchasing orange juice. This change in what consumers want (their tastes) led to an increase in demand at every price level, causing the demand curve to shift to the right.
- Did equilibrium price and quantity increase or decrease?
The equilibrium price (\( P_1 \)) increased compared to the original equilibrium price (\( P_e \)), and the equilibrium quantity (\( Q_1 \)) also increased compared to the original equilibrium quantity (\( Q_e \)).
Final Answer (for the Graph and Explanation Summary)
- The demand for orange juice increases due to a change in tastes (influencer claims), shifting the demand curve right. Equilibrium price (\( P_1 \)) and quantity (\( Q_1 \)) both increase. The graph shows the original equilibrium (\( P_e, Q_e \)) and the new equilibrium (\( P_1, Q_1 \)) after the demand shift. The "T" (Tastes and Preferences) from TRIBE explains the shift.