QUESTION IMAGE
Question
number of guests
80
70
60
50
40
30
20
10
10 20 30 40 50 60 70 80 90 100 110 x
temperature (°f)
26 guests
33 guests
41 guests
44 guests
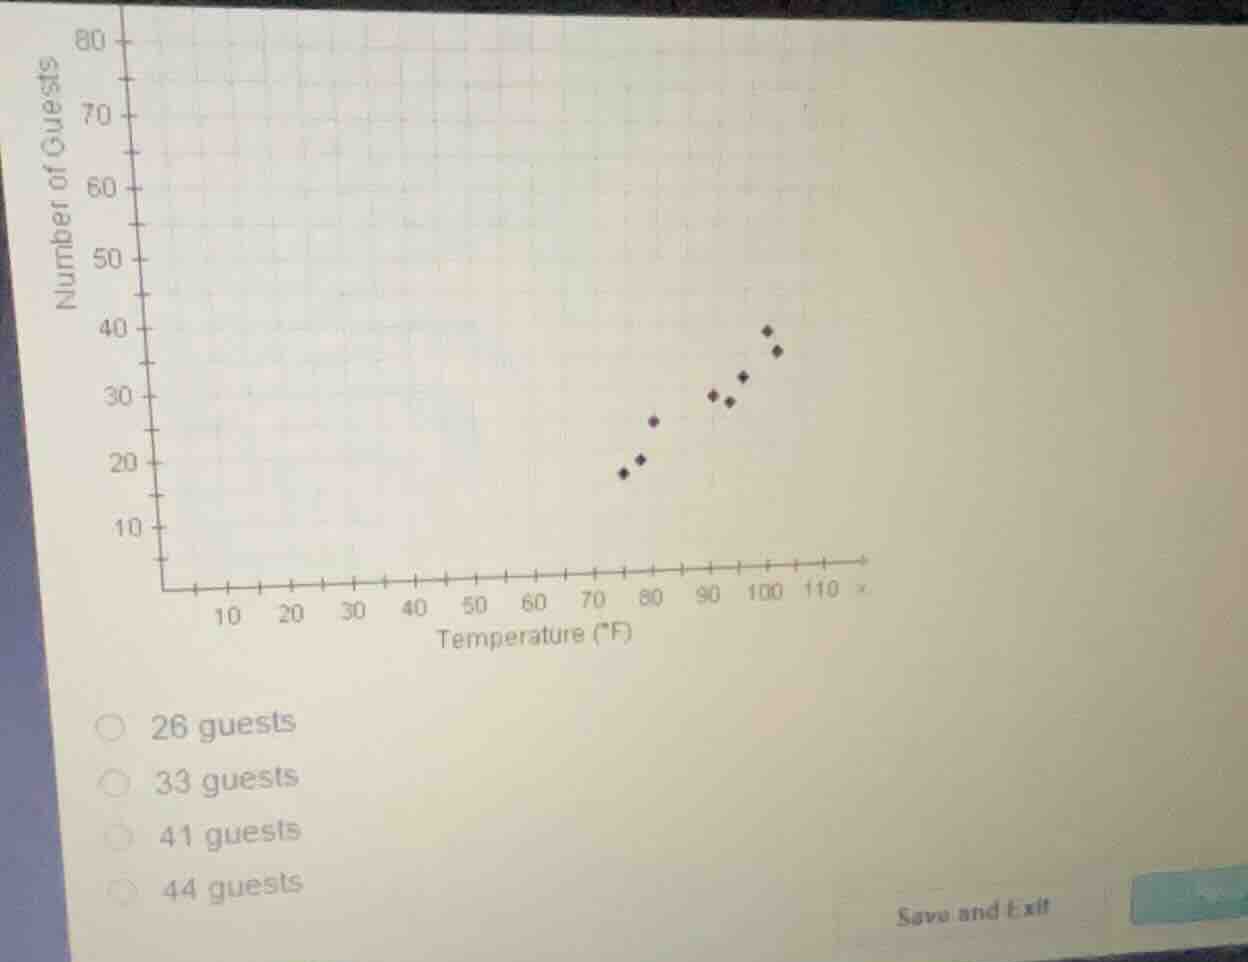
Identify the data points from the scatter plot
The scatter plot shows the relationship between Temperature (\(x\)) and Number of Guests (\(y\)). The visible data points are:
$$
(75, 18), (78, 20), (80, 26), (91, 30), (94, 29), (96, 33), (100, 40), (102, 37)
$$
Estimate the line of best fit
Using two representative points to find a linear trend, such as \((75, 18)\) and \((100, 40)\):
$$
m = \frac{40 - 18}{100 - 75} = \frac{22}{25} = 0.88
$$
$$
y - 18 = 0.88(x - 75) \implies y = 0.88x - 48
$$
Predict the number of guests at 100°F
Using the linear model at \(x = 100\):
$$
y = 0.88(100) - 48 = 88 - 48 = 40
$$
Comparing this prediction to the given multiple-choice options (26, 33, 41, 44), the closest value is 41.

Snap & solve any problem in the app
Get step-by-step solutions on Sovi AI
Photo-based solutions with guided steps
Explore more problems and detailed explanations
- 26 guests
- 33 guests
- 41 guests (Correct answer)
- 44 guests