QUESTION IMAGE
Question
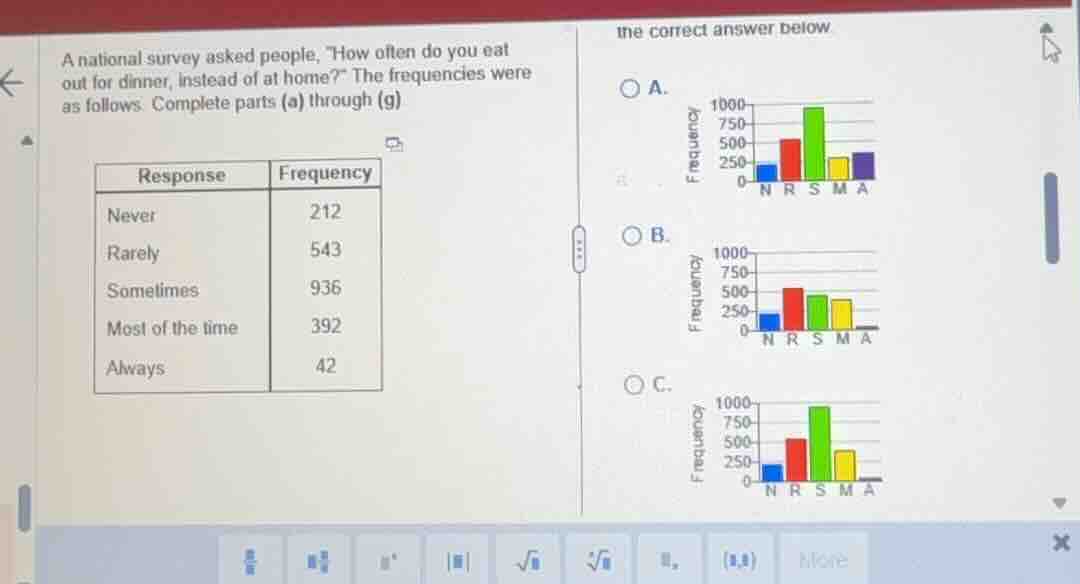
a national survey asked people, \how often do you eat out for dinner, instead of at home?\ the frequencies were as follows. complete parts (a) through (g).
\
$$\begin{tabular}{|l|c|}
\\hline
response & frequency \\\\
\\hline
never & 212 \\\\
rarely & 543 \\\\
sometimes & 936 \\\\
most of the time & 392 \\\\
always & 42 \\\\
\\hline
\\end{tabular}$$
the correct answer below.
a.
bar chart showing frequencies: n=212, r=543, s=936, m=392, a=392
b.
bar chart showing frequencies: n=212, r=543, s=450, m=392, a=42
c.
bar chart showing frequencies: n=212, r=543, s=936, m=392, a=42
⚡ Using what you learned: Organizing Data in Tables
Step 1: Match Table Frequencies to Graph Heights
We match the frequency of each response category to the heights of the bars on the graphs:
- Never (N): \(212\) (The blue bar should be just above \(200\))
- Rarely (R): \(543\) (The red bar should be slightly above \(500\))
- Sometimes (S): \(936\) (The green bar should be nearly at \(1000\))
- Most of the time (M): \(392\) (The yellow bar should be just under \(400\))
- Always (A): \(42\) (The purple bar should be very low, near \(0\))
Step 2: Evaluate the Options
- Graph A: The bar for Always (A) is shown at nearly \(400\), which is incorrect because the frequency is only \(42\).
- Graph B: The bar for Sometimes (S) is shown below \(500\), which is incorrect because the frequency is \(936\).
- Graph C:
- N is just above \(200\).
- R is just above \(500\).
- S is nearly \(1000\).
- M is just under \(400\).
- A is very close to \(0\).
This matches all the frequencies perfectly.

Snap & solve any problem in the app
Get step-by-step solutions on Sovi AI
Photo-based solutions with guided steps
Explore more problems and detailed explanations
C