QUESTION IMAGE
Question
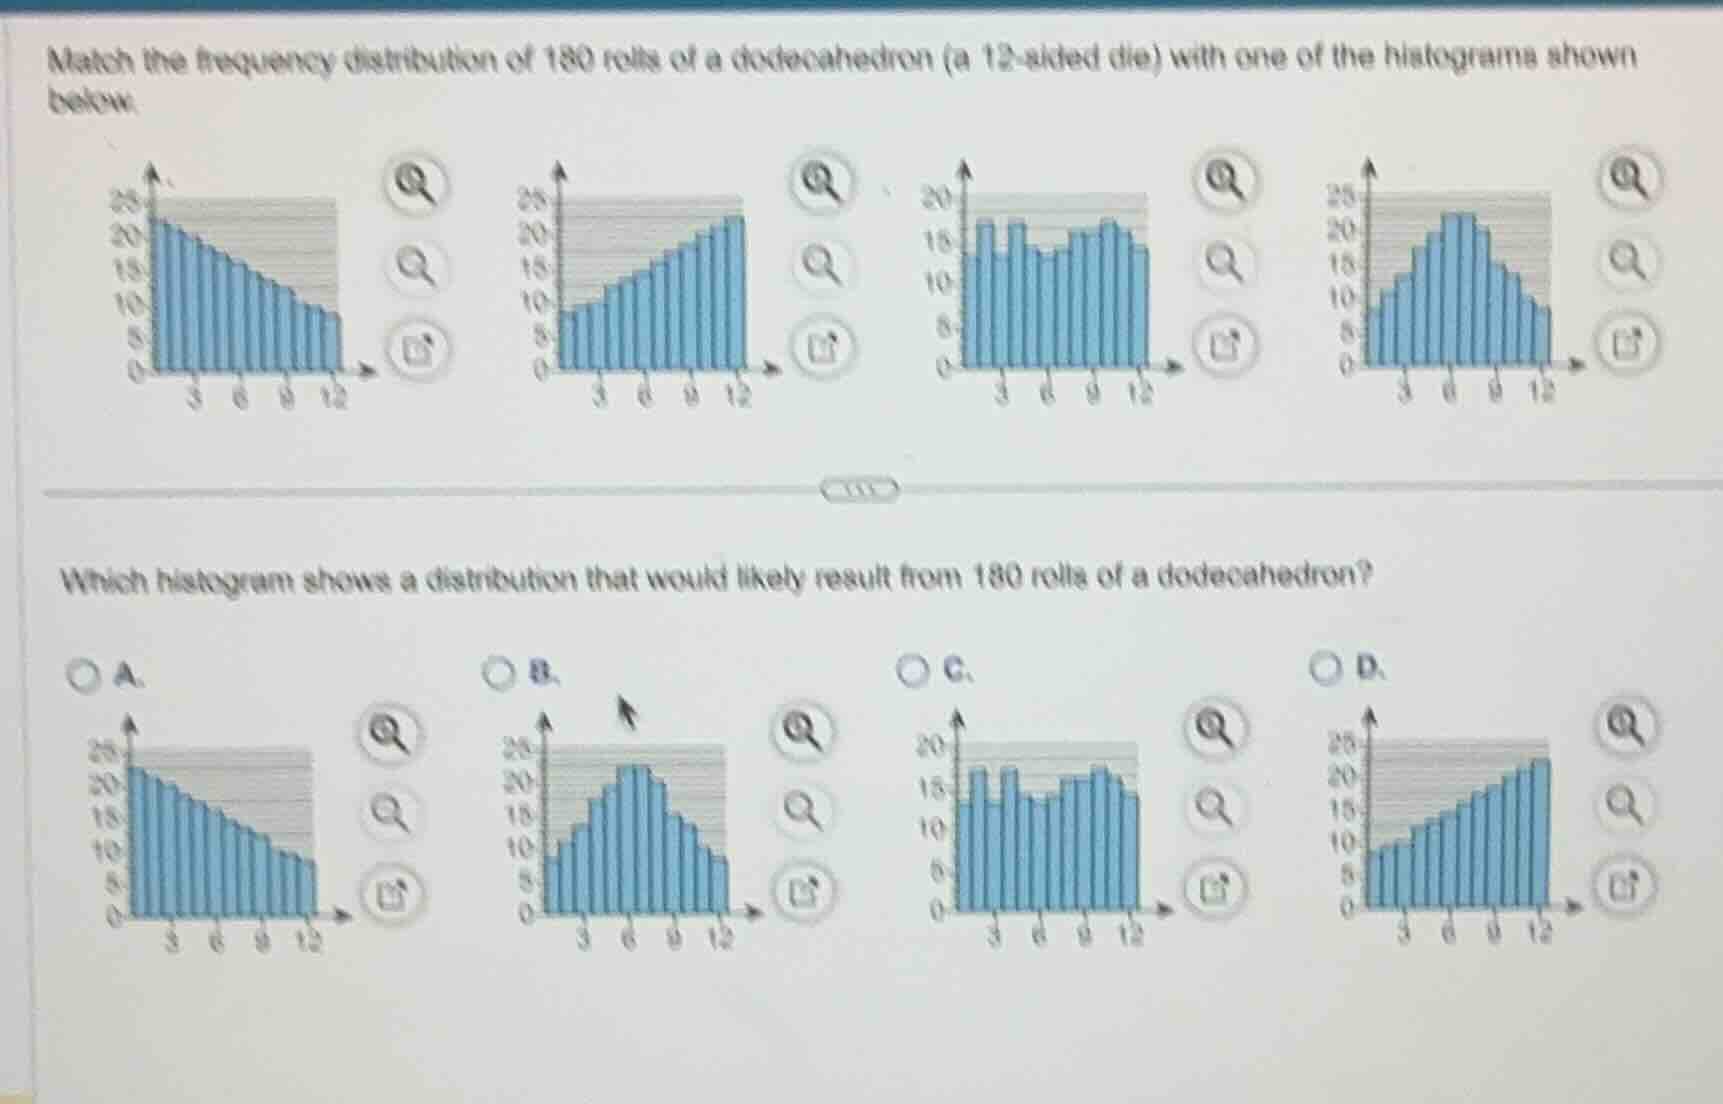
match the frequency distribution of 180 rolls of a dodecahedron (a 12-sided die) with one of the histograms shown below.
which histogram shows a distribution that would likely result from 180 rolls of a dodecahedron?
a.
b.
c.
d.
Analyze the theoretical probability distribution of a fair 12-sided die
$$
P(X = i) = \frac{1}{12} \approx 0.0833 \quad \text{for } i \in \{1, 2, \dots, 12\}
$$
Calculate the expected frequency for each outcome in 180 rolls
$$
E(f_i) = 180 \times \frac{1}{12} = 15 \quad \text{for each outcome } i
$$
Identify the histogram representing a uniform distribution with random variation
- Histogram A shows a strictly decreasing trend.
- Histogram B shows a symmetric, bell-shaped (normal) distribution.
- Histogram C shows frequencies fluctuating closely around the expected value of 15.
- Histogram D shows a strictly increasing trend.

Snap & solve any problem in the app
Get step-by-step solutions on Sovi AI
Photo-based solutions with guided steps
Explore more problems and detailed explanations
- A. The histogram showing a strictly decreasing trend from left to right.
- B. The histogram showing a symmetric, bell-shaped distribution centered around 6 and 7.
- C. The histogram showing fluctuating frequencies that are all relatively close to 15. (Correct answer)
- D. The histogram showing a strictly increasing trend from left to right.