QUESTION IMAGE
Question
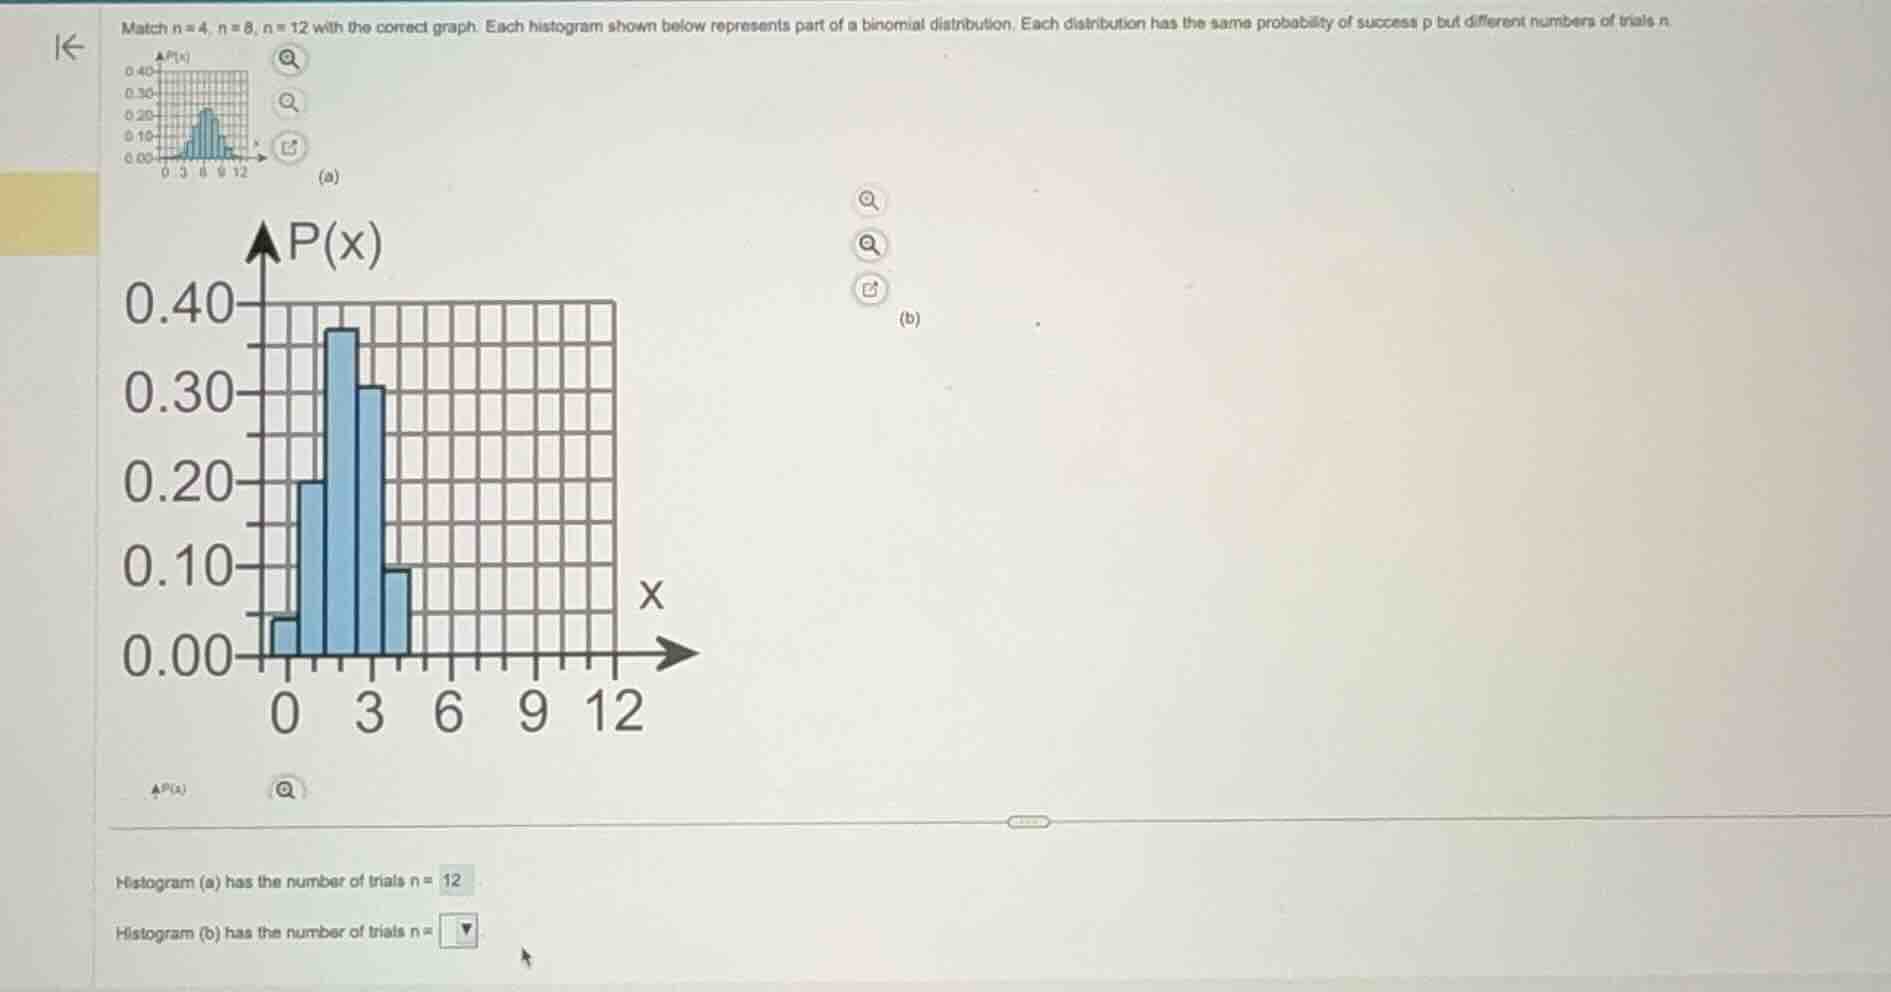
match \\(n = 4\\), \\(n = 8\\), \\(n = 12\\) with the correct graph. each histogram shown below represents part of a binomial distribution. each distribution has the same probability of success \\(p\\) but different numbers of trials \\(n\\).
histogram (a) has the number of trials \\(n = 12\\)
histogram (b) has the number of trials \\(n =\\)
Identify the maximum value of \(x\) for each histogram
The number of trials \(n\) in a binomial distribution represents the maximum possible value of the random variable \(x\) (since \(x\) ranges from \(0\) to \(n\)).
For histogram (a), the bars extend up to \(x = 12\), which means \(n = 12\).
For histogram (b), the bars extend up to \(x = 4\), which means \(n = 4\).
Match the remaining trial values
The given values of \(n\) to match are \(n = 4\), \(n = 8\), and \(n = 12\).
Since histogram (a) corresponds to \(n = 12\), and histogram (b) has non-zero probabilities only up to \(x = 4\), histogram (b) must correspond to \(n = 4\).

Snap & solve any problem in the app
Get step-by-step solutions on Sovi AI
Photo-based solutions with guided steps
Explore more problems and detailed explanations
Histogram (a) has the number of trials n = 12
Histogram (b) has the number of trials n = <blank>4</blank>