QUESTION IMAGE
Question
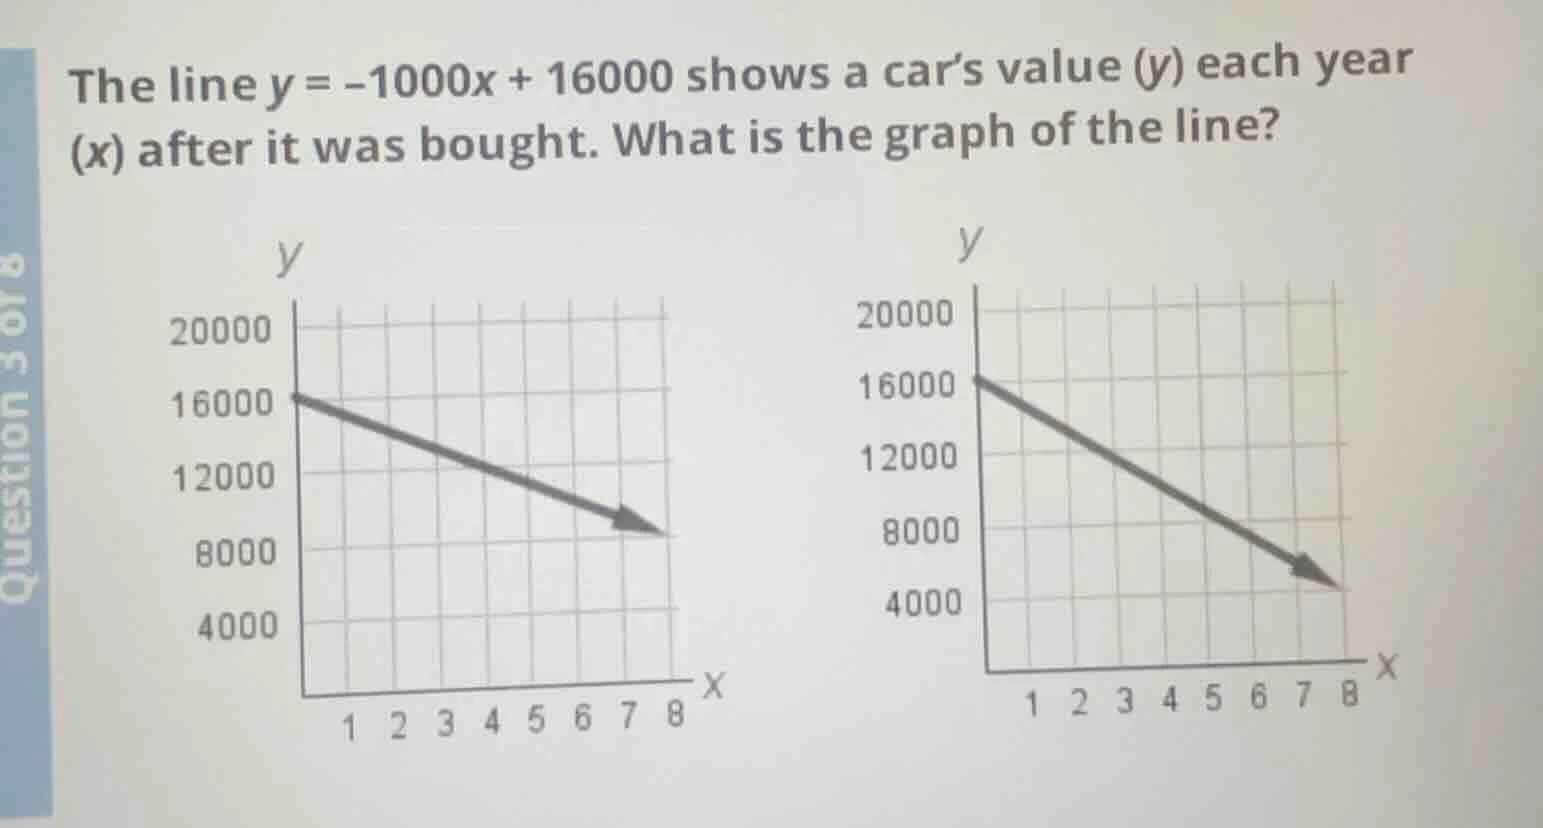
the line $y = -1000x + 16000$ shows a car’s value ($y$) each year ($x$) after it was bought. what is the graph of the line?
two graphs are shown, with y - axes labeled with values 4000, 8000, 12000, 16000, 20000 and x - axes labeled from 1 to 8. the first graph has a line starting at (0,16000) and decreasing, the second graph also has a line starting at (0,16000) and decreasing, with different slopes or end points implied by the arrows.
Step1: Analyze the y - intercept
The equation of the line is in slope - intercept form \(y = mx + b\), where \(b\) is the y - intercept. For the line \(y=- 1000x + 16000\), when \(x = 0\) (the year when the car is bought), \(y=16000\). So the line should pass through the point \((0,16000)\).
Step2: Analyze the slope and find another point
The slope \(m=-1000\), which means for every increase of 1 in \(x\) (every year), \(y\) (the car's value) decreases by 1000. Let's find the value of \(y\) when \(x = 8\). Substitute \(x = 8\) into the equation: \(y=-1000\times8 + 16000=-8000 + 16000 = 8000\)? Wait, no, wait. Wait, the first graph: when \(x = 8\), \(y = 8000\)? Wait, no, let's recalculate. Wait, \(y=-1000x + 16000\). Let's find the x - intercept (when \(y = 0\)): \(0=-1000x+16000\), \(1000x = 16000\), \(x = 16\). But the graphs have \(x\) up to 8. Let's check the value of \(y\) when \(x = 8\): \(y=-1000\times8+16000=-8000 + 16000 = 8000\). Now look at the two graphs:
First graph: At \(x = 0\), \(y = 16000\); at \(x = 8\), \(y = 8000\) (since the arrow is at \(y = 8000\) when \(x = 8\)).
Second graph: At \(x = 0\), \(y = 16000\); at \(x = 8\), \(y = 4000\) (since the arrow is at \(y = 4000\) when \(x = 8\)).
Wait, let's check the slope. The slope is - 1000, so the change in \(y\) over change in \(x\) is - 1000. So for \(\Delta x=1\), \(\Delta y=- 1000\).
In the first graph, from \(x = 0\) (\(y = 16000\)) to \(x = 8\) (\(y = 8000\)), \(\Delta x = 8\), \(\Delta y=8000 - 16000=-8000\), so the slope is \(\frac{\Delta y}{\Delta x}=\frac{-8000}{8}=-1000\), which matches the slope of the line \(y=-1000x + 16000\).
In the second graph, from \(x = 0\) (\(y = 16000\)) to \(x = 8\) (\(y = 4000\)), \(\Delta y=4000 - 16000=-12000\), \(\Delta x = 8\), slope is \(\frac{-12000}{8}=-1500\), which does not match.
Wait, I made a mistake earlier. Let's recalculate the value of \(y\) when \(x = 8\) correctly. \(y=-1000x + 16000\). So when \(x = 8\), \(y=-8000 + 16000 = 8000\). So the first graph has \(y = 8000\) when \(x = 8\), which is correct. The second graph has \(y = 4000\) when \(x = 8\), which would correspond to a slope of \(\frac{4000 - 16000}{8}=\frac{-12000}{8}=-1500\), which is not - 1000. So the first graph is correct.
Wait, let's check the grid. In the first graph, the y - axis has 16000 at the top, then 12000, 8000, 4000. The x - axis goes from 0 to 8. The line starts at (0,16000) and ends at (8,8000), with a slope of - 1000 (since from x=0 to x = 8, y decreases by 8000, so per year, it decreases by 1000).
In the second graph, from x = 0 to x = 8, y decreases by 12000, so per year, it decreases by 1500, which is not the slope of the given line. So the first graph (the left - hand graph) is the graph of the line \(y=-1000x + 16000\).

Snap & solve any problem in the app
Get step-by-step solutions on Sovi AI
Photo-based solutions with guided steps
Explore more problems and detailed explanations
The graph on the left (with \(y = 8000\) when \(x = 8\)) is the graph of the line \(y=-1000x + 16000\).