QUESTION IMAGE
Question
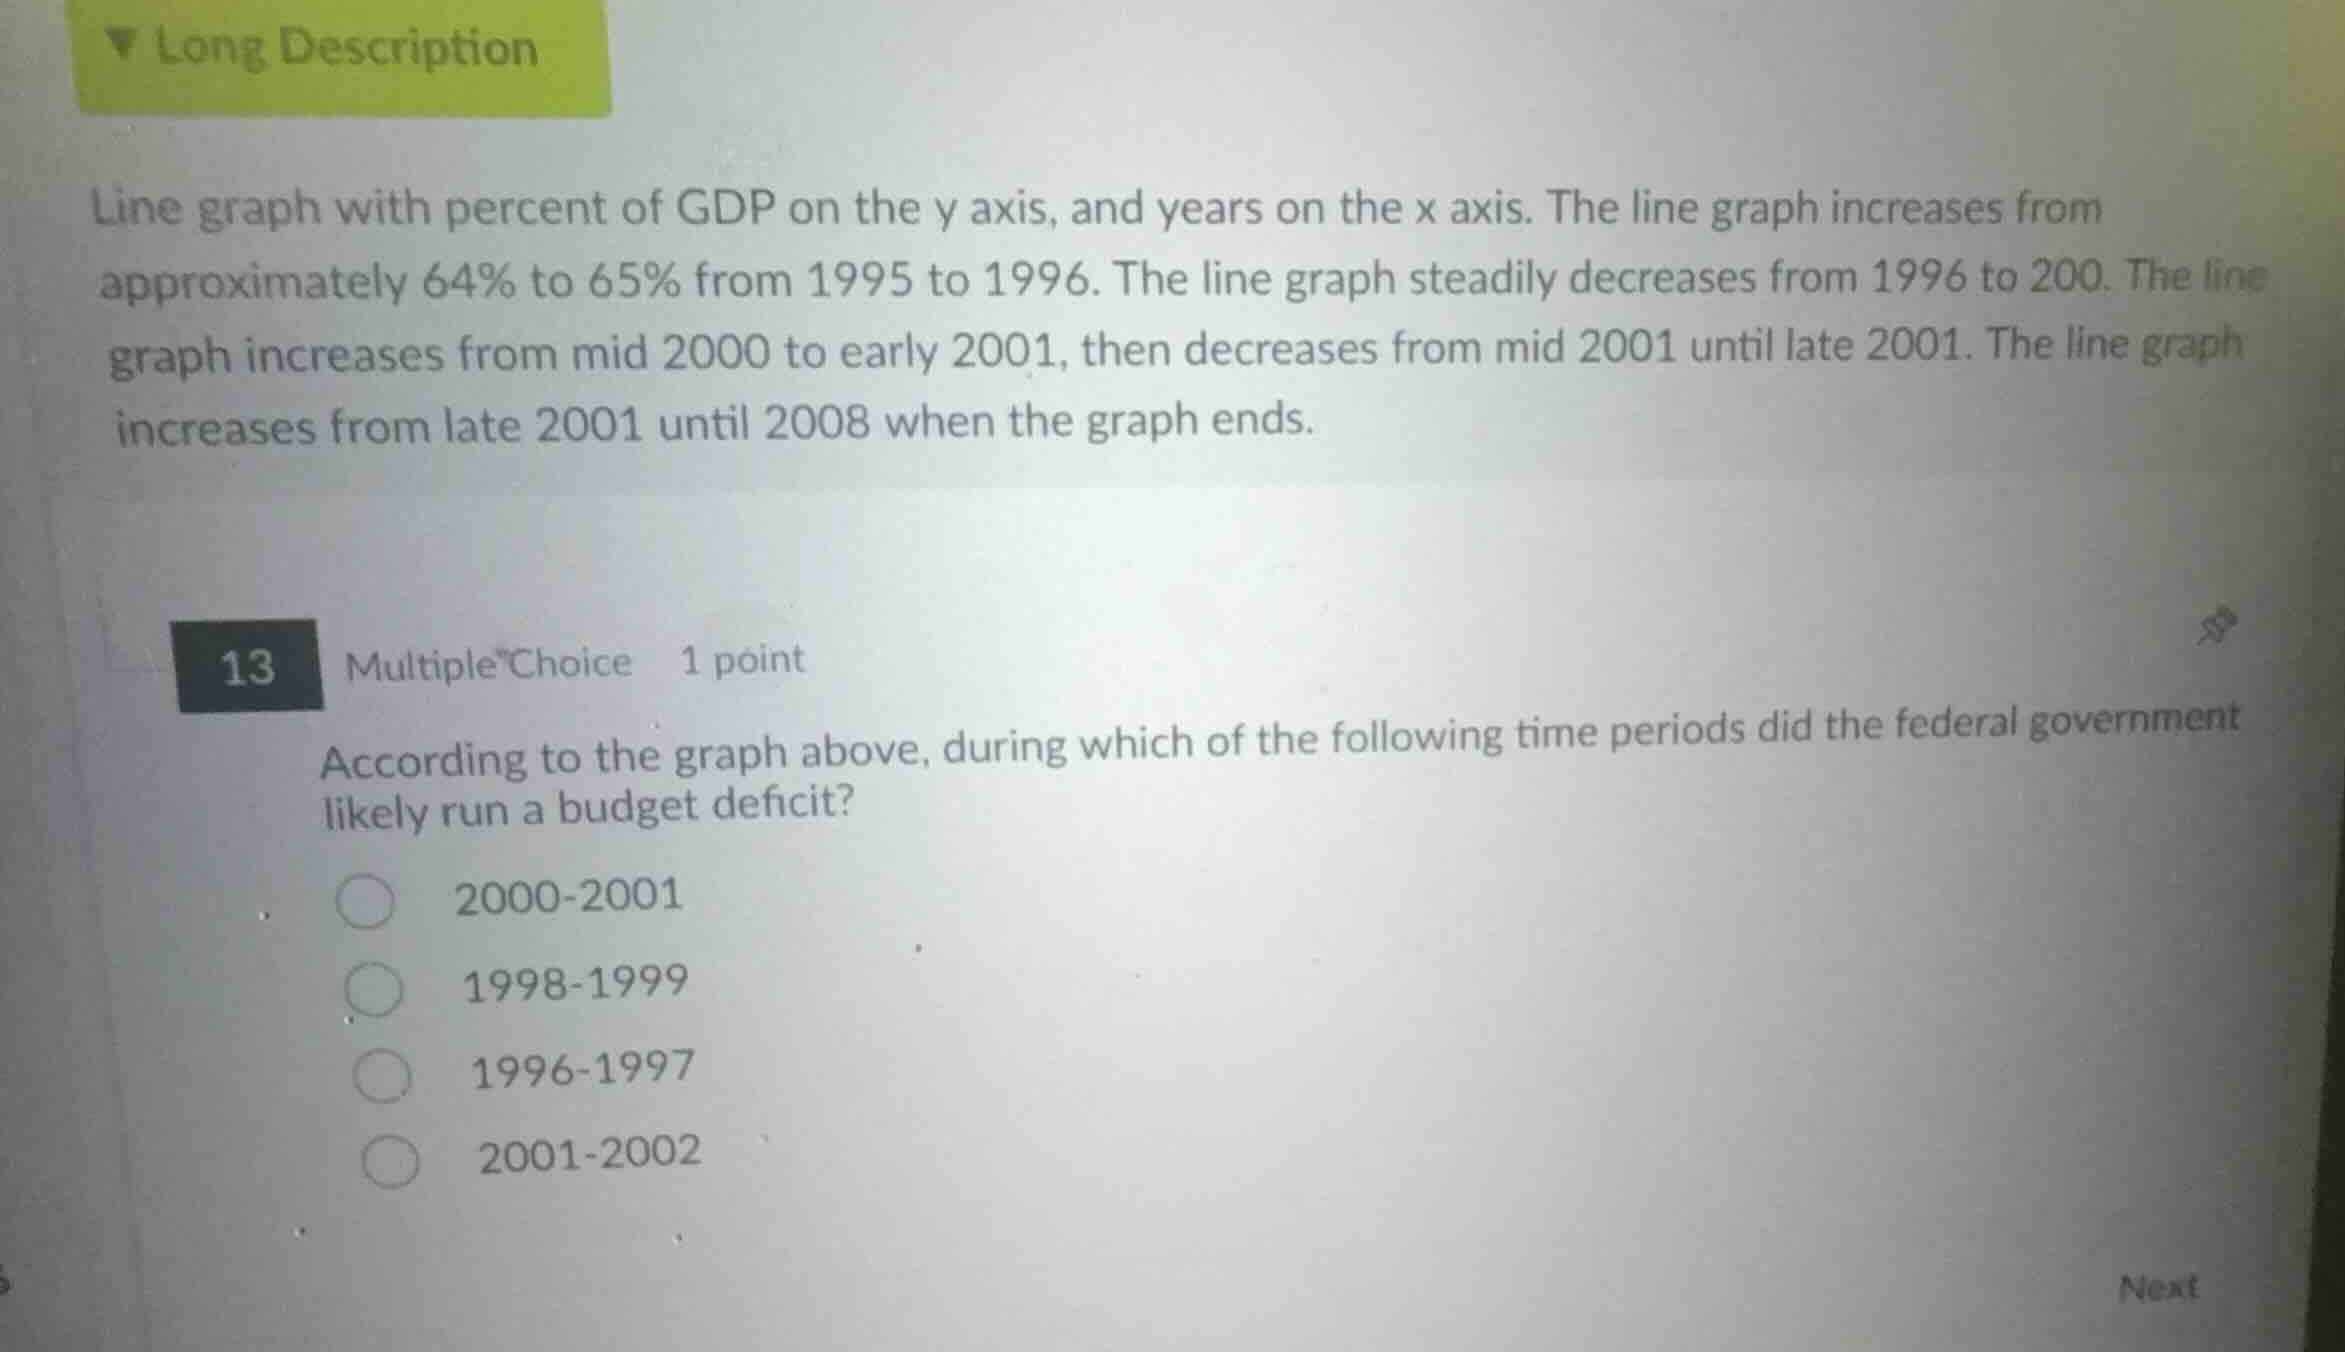
line graph with percent of gdp on the y axis, and years on the x axis. the line graph increases from approximately 64% to 65% from 1995 to 1996. the line graph steadily decreases from 1996 to 200. the line graph increases from mid 2000 to early 2001, then decreases from mid 2001 until late 2001. the line graph increases from late 2001 until 2008 when the graph ends.
13 multiple choice 1 point
according to the graph above, during which of the following time periods did the federal government likely run a budget deficit?
2000-2001
1998-1999
1996-1997
2001-2002
Identify the graph's variables
Using the Data Analysis knowledge point
The graph represents the national debt as a percentage of GDP on the y-axis over time (years) on the x-axis.
Relate debt changes to budget balance
Using the National Debt to GDP knowledge point
A budget deficit occurs when government spending exceeds tax revenues, requiring the government to borrow money, which increases the national debt. Conversely, a budget surplus reduces the national debt. Therefore, during a period of budget deficit, we expect the national debt as a percentage of GDP to increase.
Analyze the time periods
We examine the trend of the line graph for each given option:
- 2000-2001: The description states the graph "steadily decreases from 1996 to 2000" (surplus period) and "increases from mid 2000 to early 2001, then decreases from mid 2001 until late 2001." This shows mixed, non-sustained growth.
- 1998-1999: This falls within the steady decrease from 1996 to 2000, indicating a budget surplus.
- 1996-1997: This also falls within the steady decrease from 1996 to 2000, indicating a budget surplus.
- 2001-2002: The description states the graph "increases from late 2001 until 2008." A sustained increase in the debt-to-GDP ratio starting in late 2001 and continuing through 2002 indicates a transition to persistent budget deficits.
Select the correct option
The period 2001-2002 marks the beginning of a sustained upward trend in the debt-to-GDP ratio, indicating that the federal government was running a budget deficit during this time.

Snap & solve any problem in the app
Get step-by-step solutions on Sovi AI
Photo-based solutions with guided steps
Explore more problems and detailed explanations
- (A) 2000-2001
- (B) 1998-1999
- (C) 1996-1997
- (D) 2001-2002 (Correct answer)