QUESTION IMAGE
Question
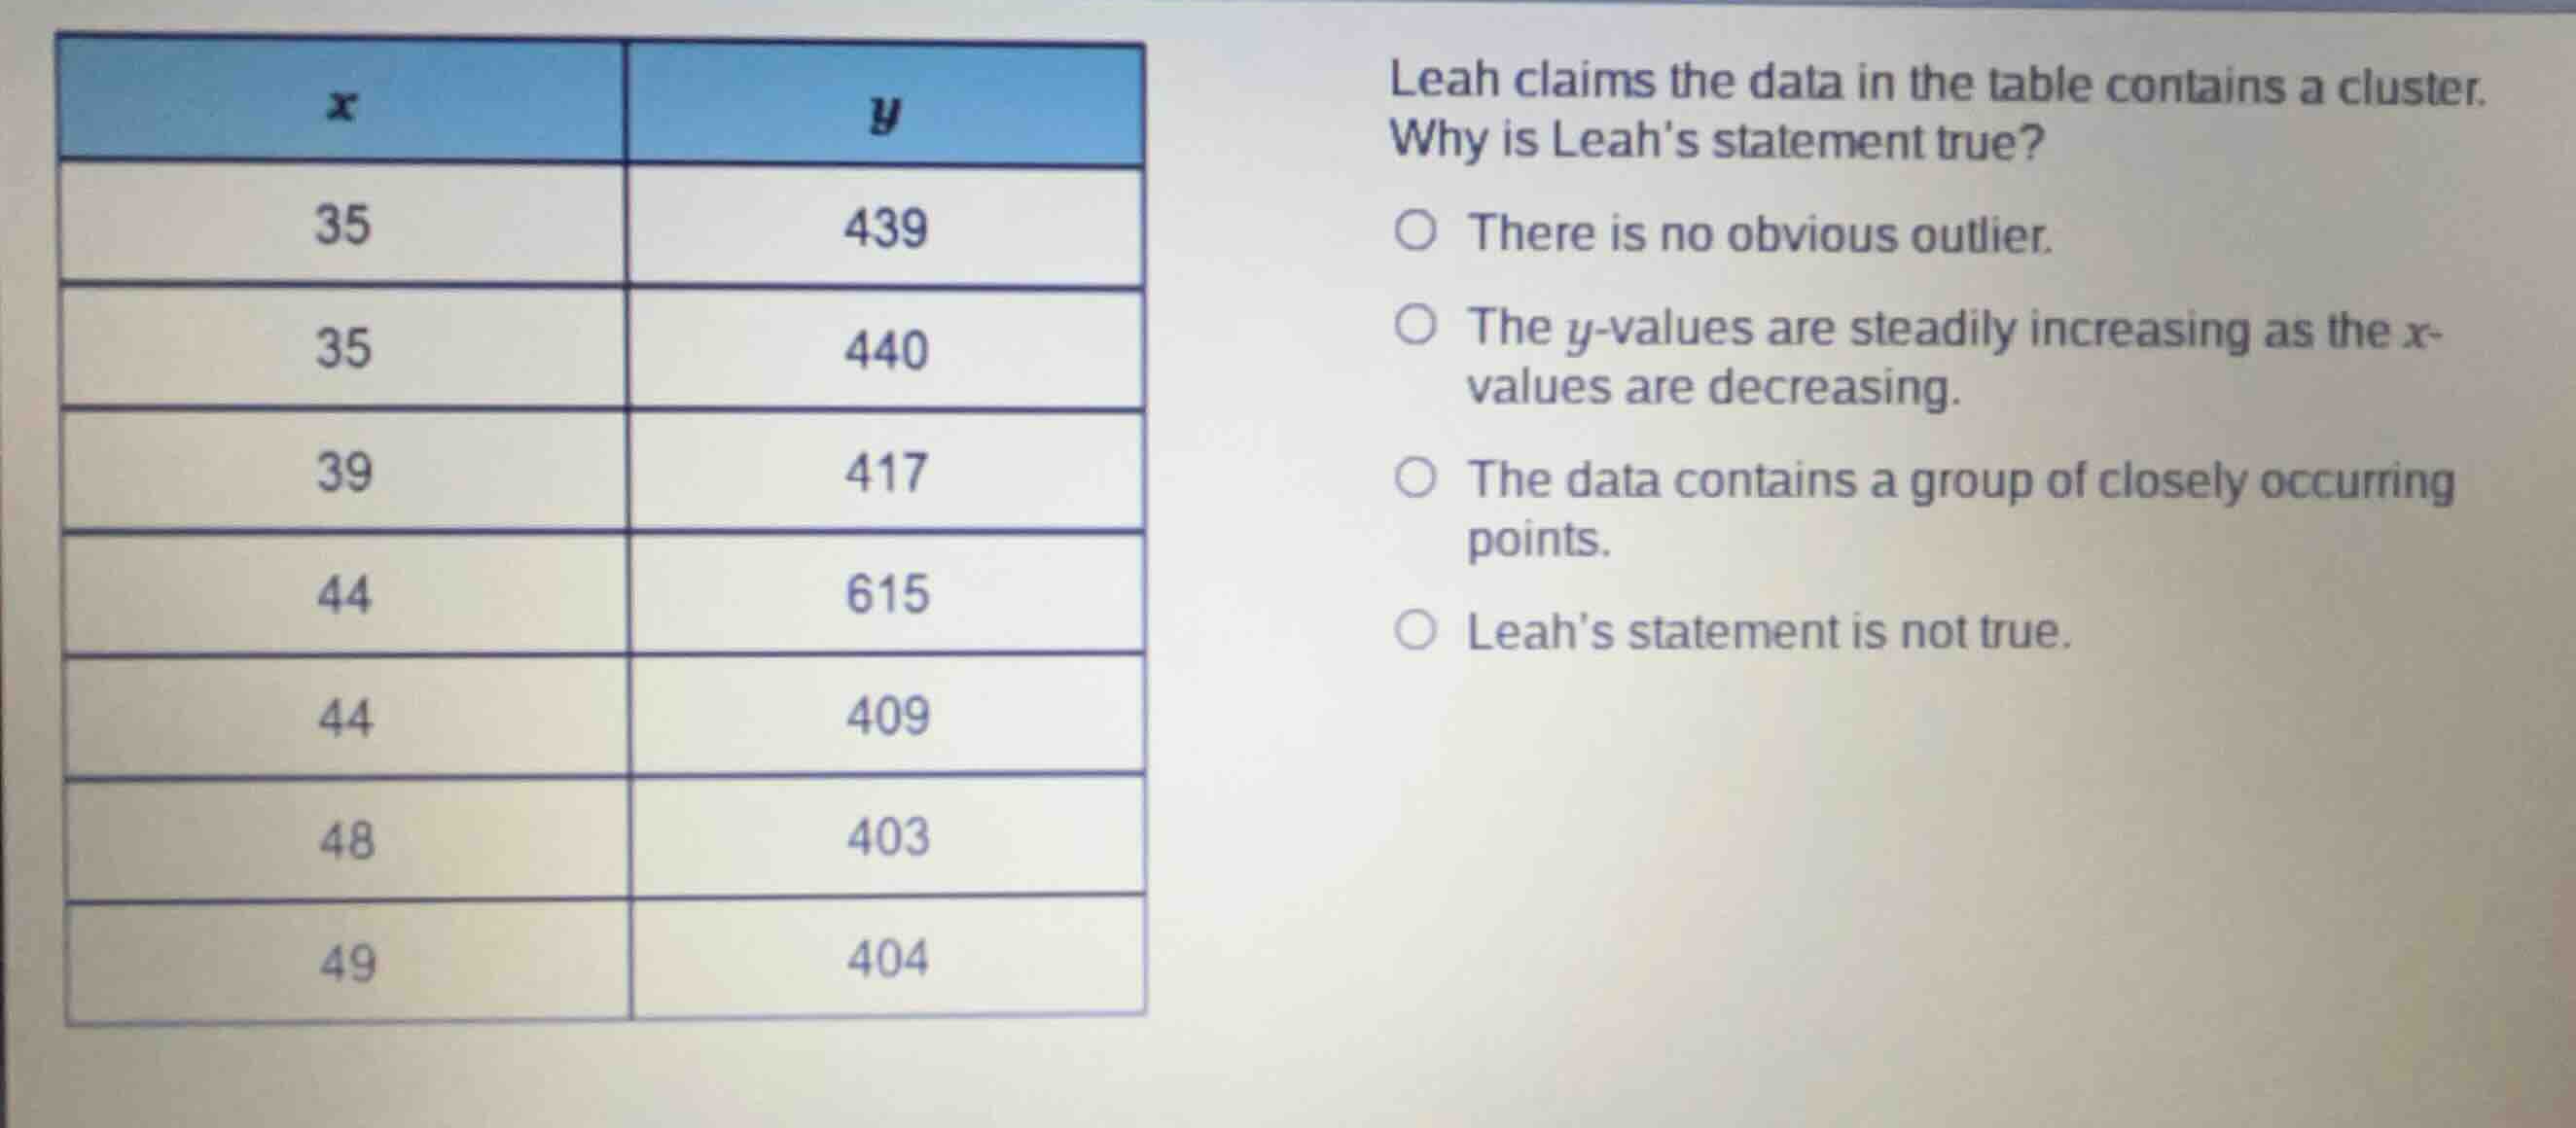
leah claims the data in the table contains a cluster. why is leahs statement true?
there is no obvious outlier.
the \\(y\\)-values are steadily increasing as the \\(x\\)-values are decreasing.
the data contains a group of closely occurring points.
leahs statement is not true.
Define a cluster in bivariate data
A cluster in a scatterplot or bivariate data set is a distinct group of data points that lie close together.
Analyze the given data points
The data points are:
- \((35, 439)\)
- \((35, 440)\)
- \((39, 417)\)
- \((44, 615)\)
- \((44, 409)\)
- \((48, 403)\)
- \((49, 404)\)
Six of these seven points have \(y\)-values clustered tightly between \(403\) and \(440\) for \(x\)-values between \(35\) and \(49\). This concentration of closely occurring points forms a cluster, while the point \((44, 615)\) lies far away as an outlier.
Evaluate the given options
- "There is no obvious outlier" is false because \((44, 615)\) is a clear outlier.
- "The \(y\)-values are steadily increasing as the \(x\)-values are decreasing" is false.
- "The data contains a group of closely occurring points" correctly defines why a cluster exists.
- "Leah's statement is not true" is incorrect because a cluster is indeed present.

Snap & solve any problem in the app
Get step-by-step solutions on Sovi AI
Photo-based solutions with guided steps
Explore more problems and detailed explanations
- There is no obvious outlier.
- The y-values are steadily increasing as the x-values are decreasing.
- The data contains a group of closely occurring points. (Correct answer)
- Leah's statement is not true.