QUESTION IMAGE
Question
Question was provided via image upload.
Analyze the target correlation coefficient
$$
r \approx -1
$$
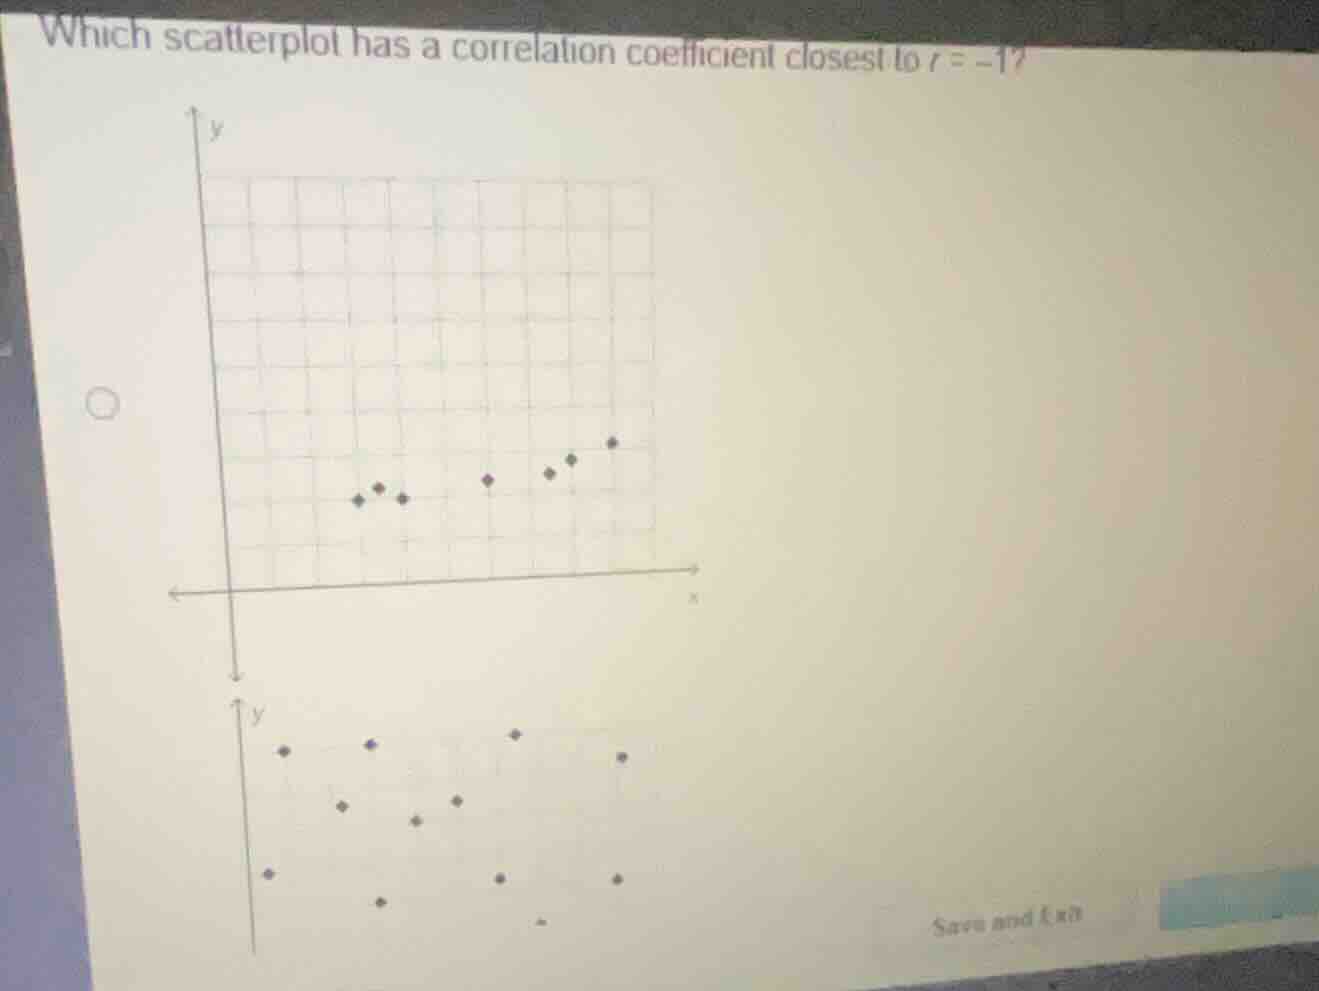
Evaluate the visible scatterplots
- First plot: Points show a moderate positive linear trend, meaning \(r > 0\).
- Second plot: Points are highly scattered with no clear linear pattern, meaning \(r \approx 0\).
- Missing options: A scatterplot with a correlation coefficient closest to \(-1\) must show a strong, negative linear association (points tightly clustered around a line sloping downwards from left to right).

Snap & solve any problem in the app
Get step-by-step solutions on Sovi AI
Photo-based solutions with guided steps
Explore more problems and detailed explanations
- (A) A scatterplot showing points tightly clustered along a line sloping downwards from left to right (strong negative correlation)
- (B) The first visible scatterplot (moderate positive correlation)
- (C) The second visible scatterplot (weak or no correlation)