QUESTION IMAGE
Question
Question was provided via image upload.
Identify missing data
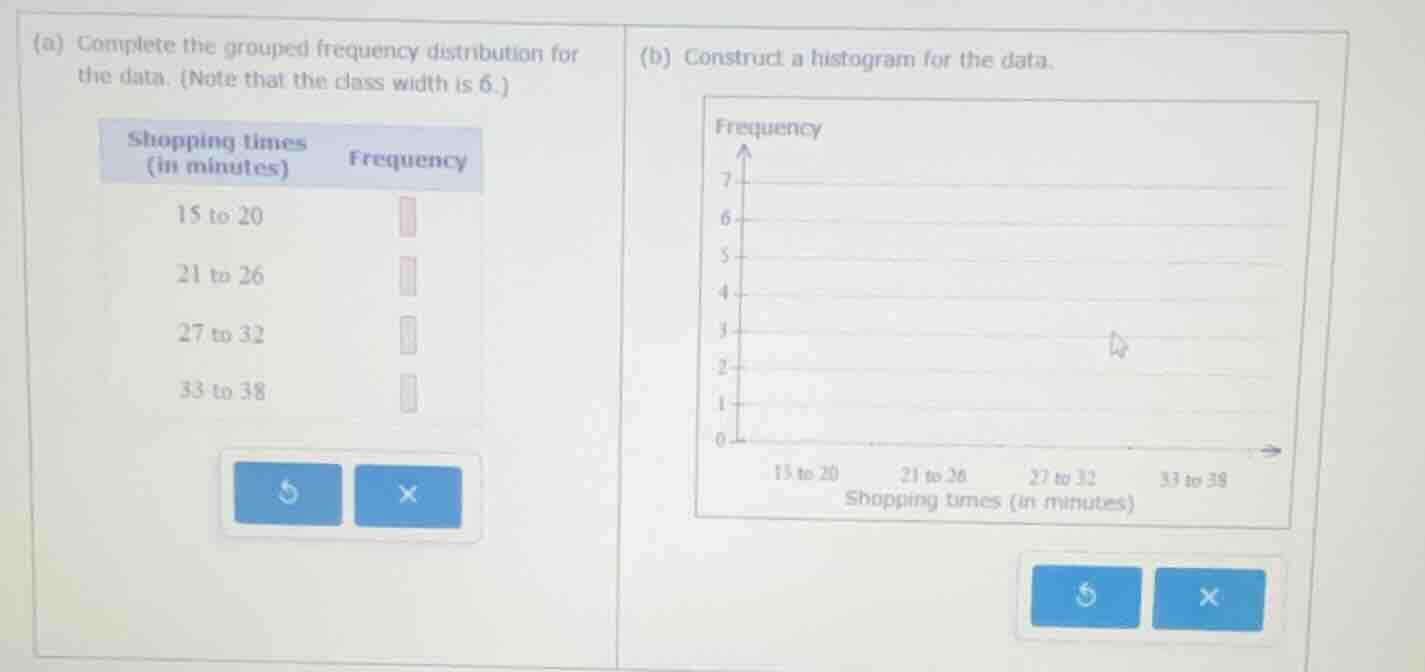
The problem asks to complete a grouped frequency distribution and construct a histogram. However, the raw data set (the list of shopping times in minutes) is not visible in the provided image.
Formulate conditional solution
Since the raw data values are missing from the image, we cannot calculate the exact frequencies for each interval:
- \(15\text{ to }20\)
- \(21\text{ to }26\)
- \(27\text{ to }32\)
- \(33\text{ to }38\)
To complete this task once you have the data:
- Count how many data points fall into each of the four intervals.
- Enter those counts into the corresponding frequency boxes in part (a).
- Draw vertical bars in part (b) up to the height of each calculated frequency for each interval.

Snap & solve any problem in the app
Get step-by-step solutions on Sovi AI
Photo-based solutions with guided steps
Explore more problems and detailed explanations
The raw data set containing the shopping times is missing from the image. To complete the problem:
- Count the frequencies: Count how many numbers in your data set fall within each range (inclusive):
- 15 to 20
- 21 to 26
- 27 to 32
- 33 to 38
- Fill in the table: Enter these counts into the frequency column for part (a).
- Draw the histogram: For part (b), draw a vertical bar for each interval on the horizontal axis up to the height of its corresponding frequency on the vertical axis.