QUESTION IMAGE
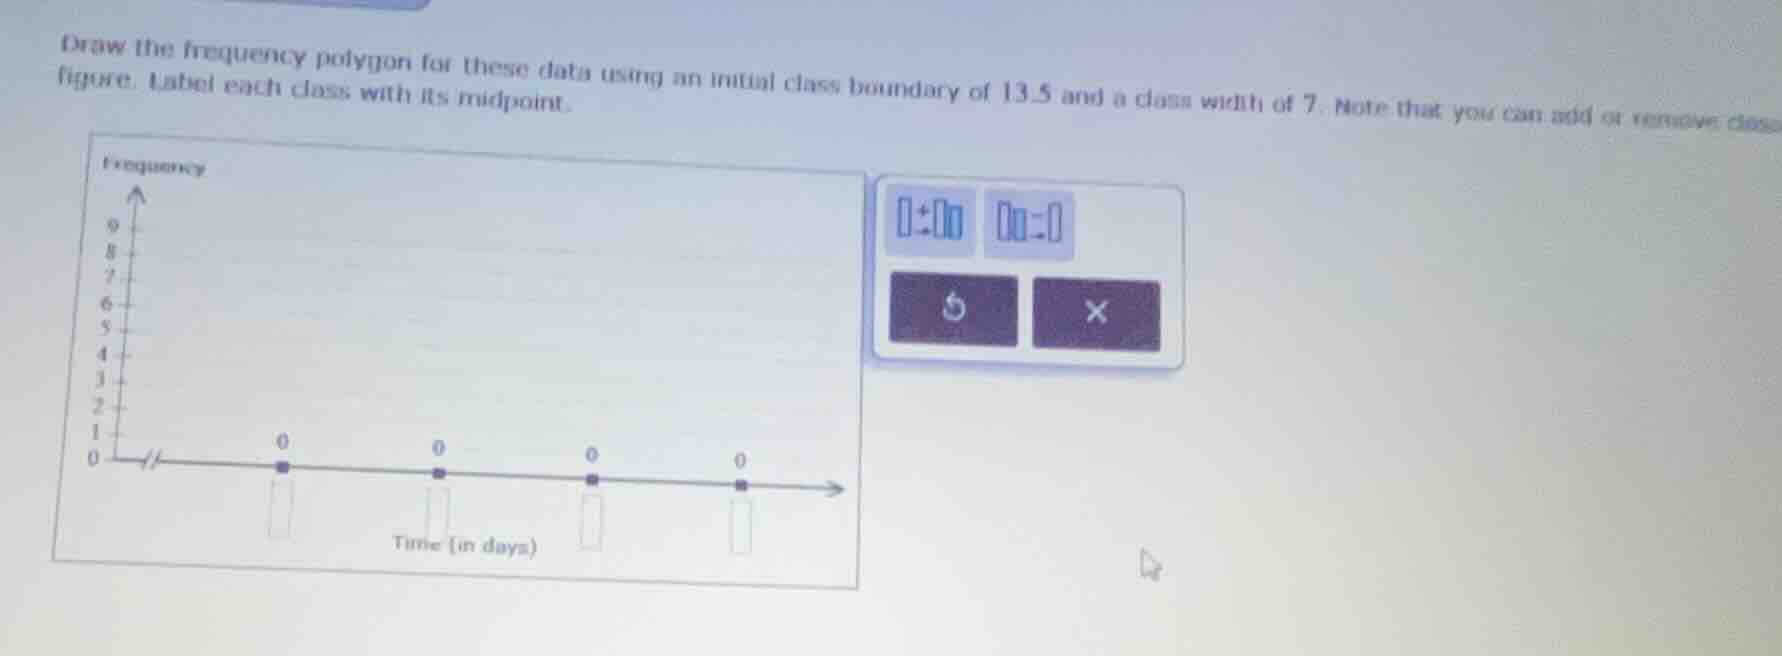
Question
Question was provided via image upload.
Identify the missing data
The problem asks to "Draw the frequency polygon for these data using an initial class boundary of 13.5 and a class width of 7." However, the raw data set (the list of numbers or frequency table) is not visible in the provided image. It has been cut off or is missing from the screen capture.
Determine class midpoints from parameters
Even without the raw data, we can calculate the class boundaries and midpoints using the given parameters:
- Initial class boundary: \(13.5\)
- Class width: \(7\)
The first class interval has boundaries:
The midpoint \(m_1\) of the first class is:
Subsequent class midpoints are found by repeatedly adding the class width of \(7\):
- Second class midpoint: \(17 + 7 = 24\) (boundaries: \(20.5\) to \(27.5\))
- Third class midpoint: \(24 + 7 = 31\) (boundaries: \(27.5\) to \(34.5\))
- Fourth class midpoint: \(31 + 7 = 38\) (boundaries: \(34.5\) to \(41.5\))
Construct the frequency polygon structure
A frequency polygon must start and end on the horizontal axis (frequency of 0) at the midpoints of empty classes immediately preceding the first class and following the last class:
- Preceding anchor midpoint: \(17 - 7 = 10\)
- Following anchor midpoint: \(38 + 7 = 45\) (assuming 4 data classes)
To complete the graph, the frequency of each class from the missing data set must be plotted at these midpoints:
- \((10, 0)\)
- \((17, f_1)\)
- \((24, f_2)\)
- \((31, f_3)\)
- \((38, f_4)\)
- \((45, 0)\)

Snap & solve any problem in the app
Get step-by-step solutions on Sovi AI
Photo-based solutions with guided steps
Explore more problems and detailed explanations
The raw data set is missing from the image, which prevents plotting the exact frequencies. However, using the initial class boundary of \(13.5\) and a class width of \(7\), the class midpoints to label on the horizontal axis are:
- First Class Midpoint: \(17\) (Interval: \(13.5 - 20.5\))
- Second Class Midpoint: \(24\) (Interval: \(20.5 - 27.5\))
- Third Class Midpoint: \(31\) (Interval: \(27.5 - 34.5\))
- Fourth Class Midpoint: \(38\) (Interval: \(34.5 - 41.5\))
To anchor the frequency polygon to the horizontal axis (frequency of \(0\)), add an extra class midpoint at each end:
- Left Anchor Midpoint: \(10\)
- Right Anchor Midpoint: \(45\)