QUESTION IMAGE
Question
Question was provided via image upload.
Analyze the data distribution
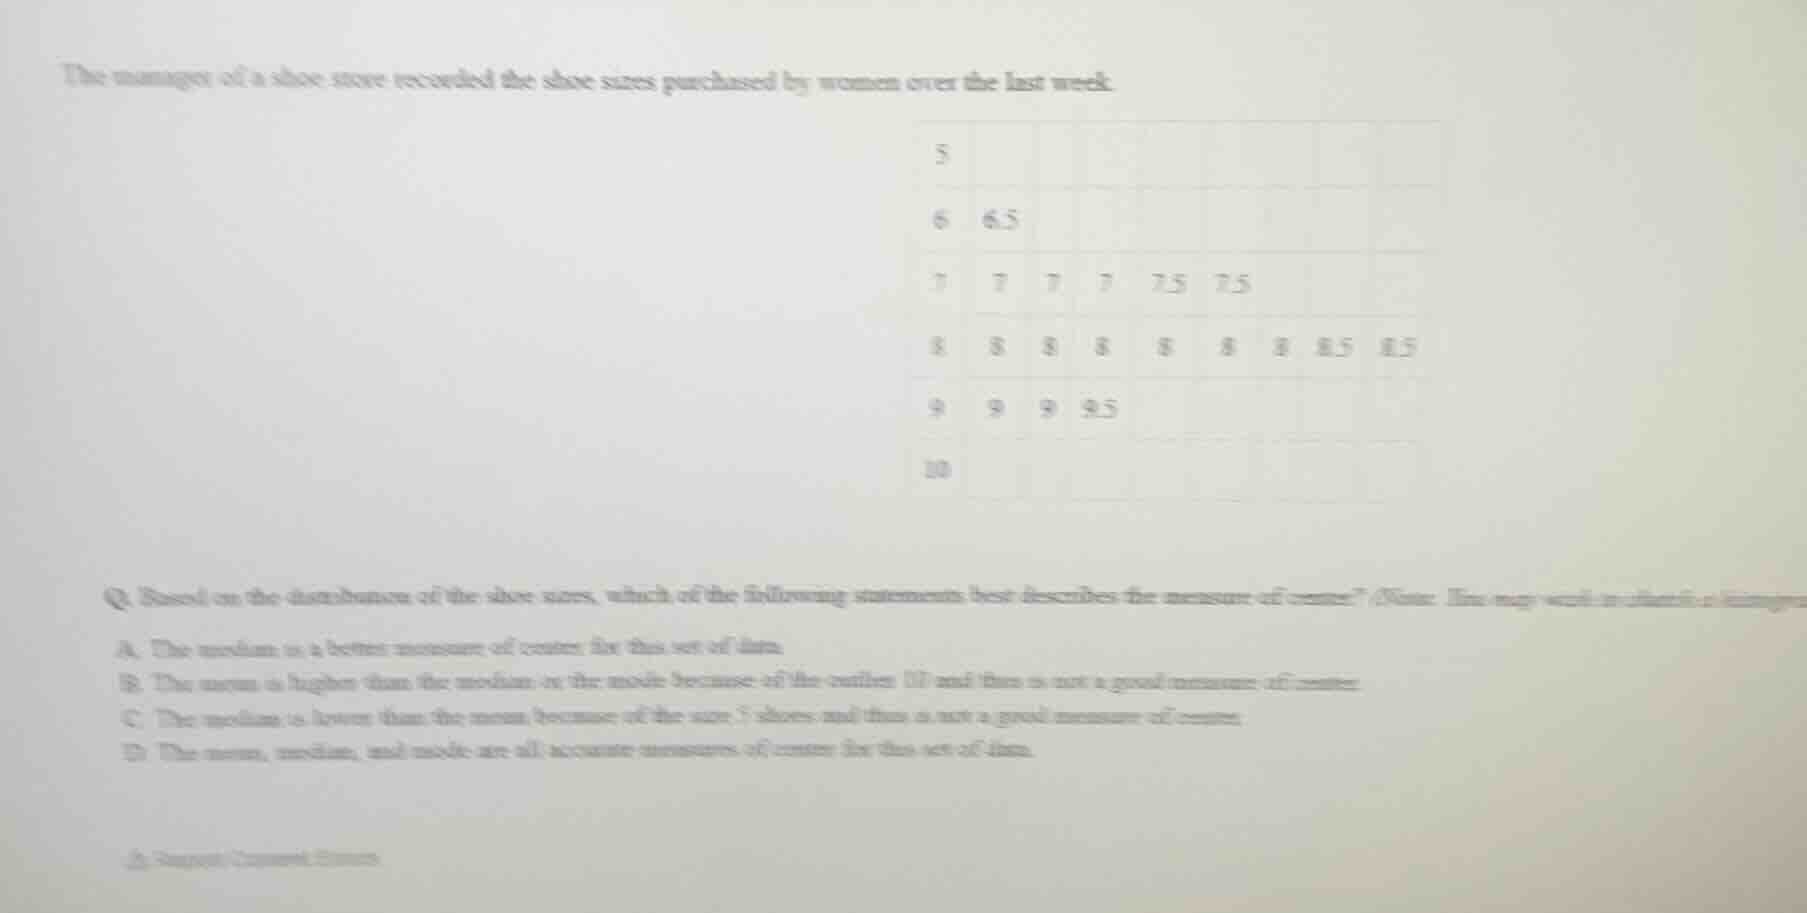
Using the Distribution Shapes knowledge point, we list the given shoe sizes from the table:
- Size 5: 1 value (5)
- Size 6: 2 values (6, 6.5)
- Size 7: 6 values (7, 7, 7, 7, 7.5, 7.5)
- Size 8: 9 values (8, 8, 8, 8, 8, 8, 8, 8.5, 8.5)
- Size 9: 4 values (9, 9, 9, 9.5)
- Size 10: 1 value (10)
The distribution is symmetric and bell-shaped, centered around size 8.
Evaluate measures of center
Using the Measures of Center knowledge point, we analyze the mean, median, and mode:
- The total number of data points is \(1 + 2 + 6 + 9 + 4 + 1 = 23\).
- The median is the 12th value, which is 8.
- The mode is 8 (occurring 7 times).
- The mean is approximately 7.8.
Since the distribution is symmetric with no extreme outliers, the mean, median, and mode are all close to each other and represent the center well.
Evaluate the given statements
We compare our findings with the options:
- Option A suggests only the median is best, which is untrue for symmetric data.
- Option B claims 10 is an outlier, but 10 is adjacent to 9.5 and fits the symmetric curve.
- Option C claims 5 is an outlier, which is also incorrect.
- Option D correctly states that the mean, median, and mode are all accurate measures of center.

Snap & solve any problem in the app
Get step-by-step solutions on Sovi AI
Photo-based solutions with guided steps
Explore more problems and detailed explanations
- A. The median is a better measure of center for this set of data.
- B. The mean is higher than the median or the mode because of the outlier 10 and thus is not a good measure of center.
- C. The median is lower than the mean because of the size 5 shoes and thus is not a good measure of center.
- D. The mean, median, and mode are all accurate measures of center for this set of data. (Correct answer)