QUESTION IMAGE
Question
Question was provided via image upload.
🆕 New Concept Discovered: Graphing Parent Functions
Recognizing basic shapes of common functions.
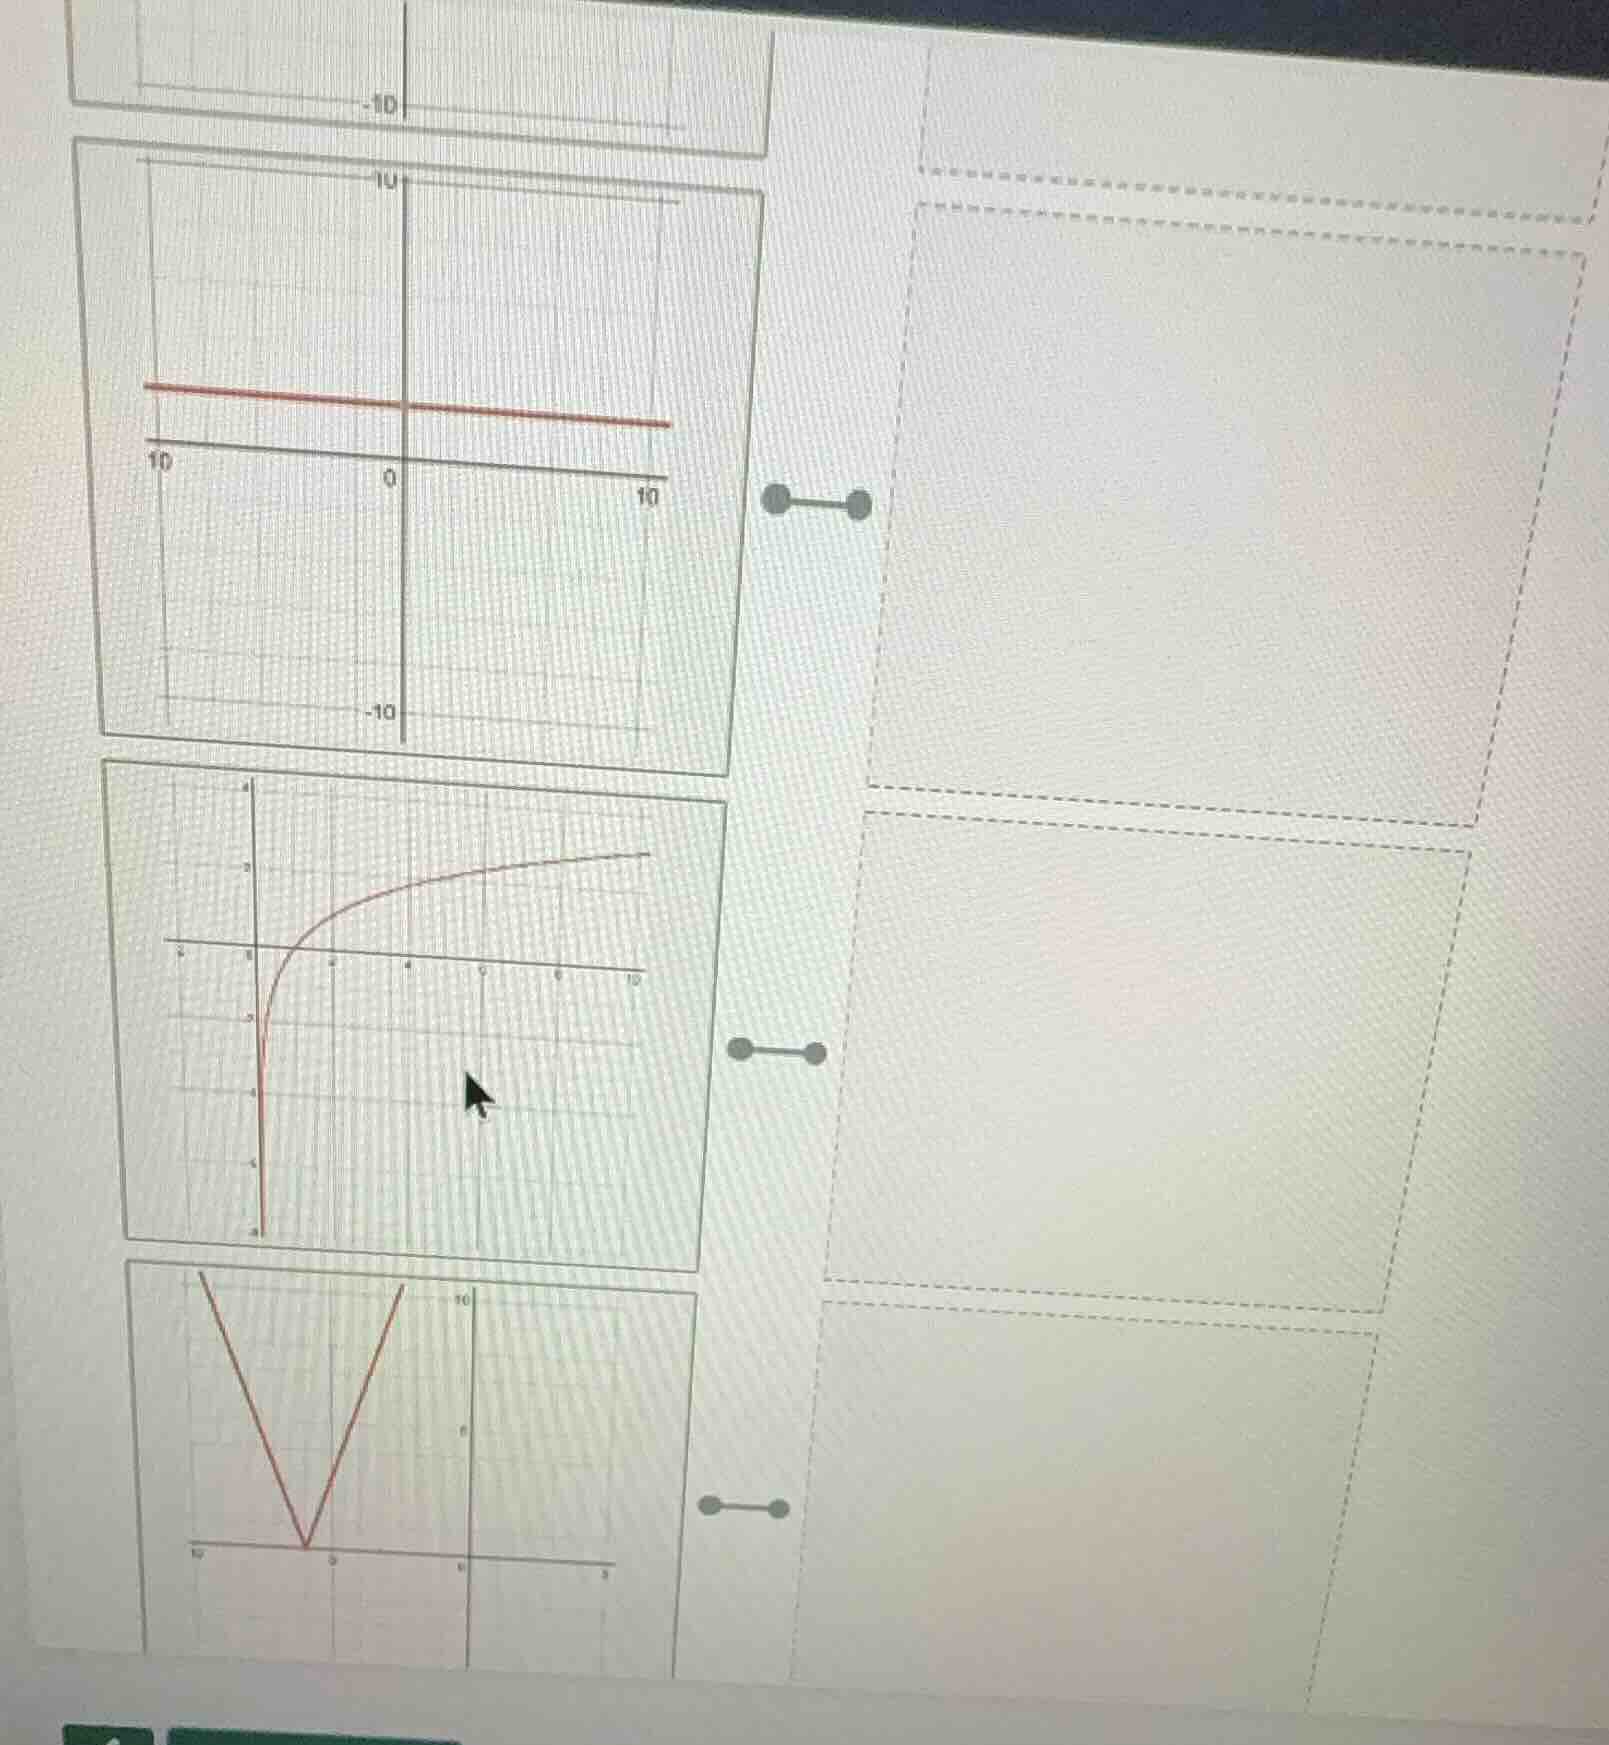
Step 1: Analyze the first graph
The first graph shows a horizontal line.
- A horizontal line has a constant \(y\)-value for all values of \(x\).
- This represents a constant function, which has the general equation:
$$ y = c $$
where \(c\) is a constant. Looking at the grid, the line is at approximately \(y = 3\).
Step 2: Analyze the second graph
The second graph shows a curve that starts near a vertical asymptote on the \(y\)-axis (\(x = 0\)), passes through the point \((1, 0)\), and increases slowly as \(x\) increases.
- This shape is characteristic of a logarithmic function.
- The general parent equation is:
$$ y = \log_b(x) $$
Step 3: Analyze the third graph
The third graph shows a V-shaped curve with a sharp corner (vertex) on the \(x\)-axis at approximately \(x = -5\).
- A V-shaped graph represents an absolute value function.
- The general parent equation is:
$$ y = |x - h| + k $$

Snap & solve any problem in the app
Get step-by-step solutions on Sovi AI
Photo-based solutions with guided steps
Explore more problems and detailed explanations
Based on the shapes of the graphs:
- First Graph (Horizontal Line): Constant Function (e.g., \(y = 3\))
- Second Graph (Curve with vertical asymptote at \(x=0\)): Logarithmic Function (e.g., \(y = \log(x)\))
- Third Graph (V-shape): Absolute Value Function (e.g., \(y = |x + 5|\))