QUESTION IMAGE
Question
Question was provided via image upload.
Analyze the trend between x and y
Looking at the data points in the table:
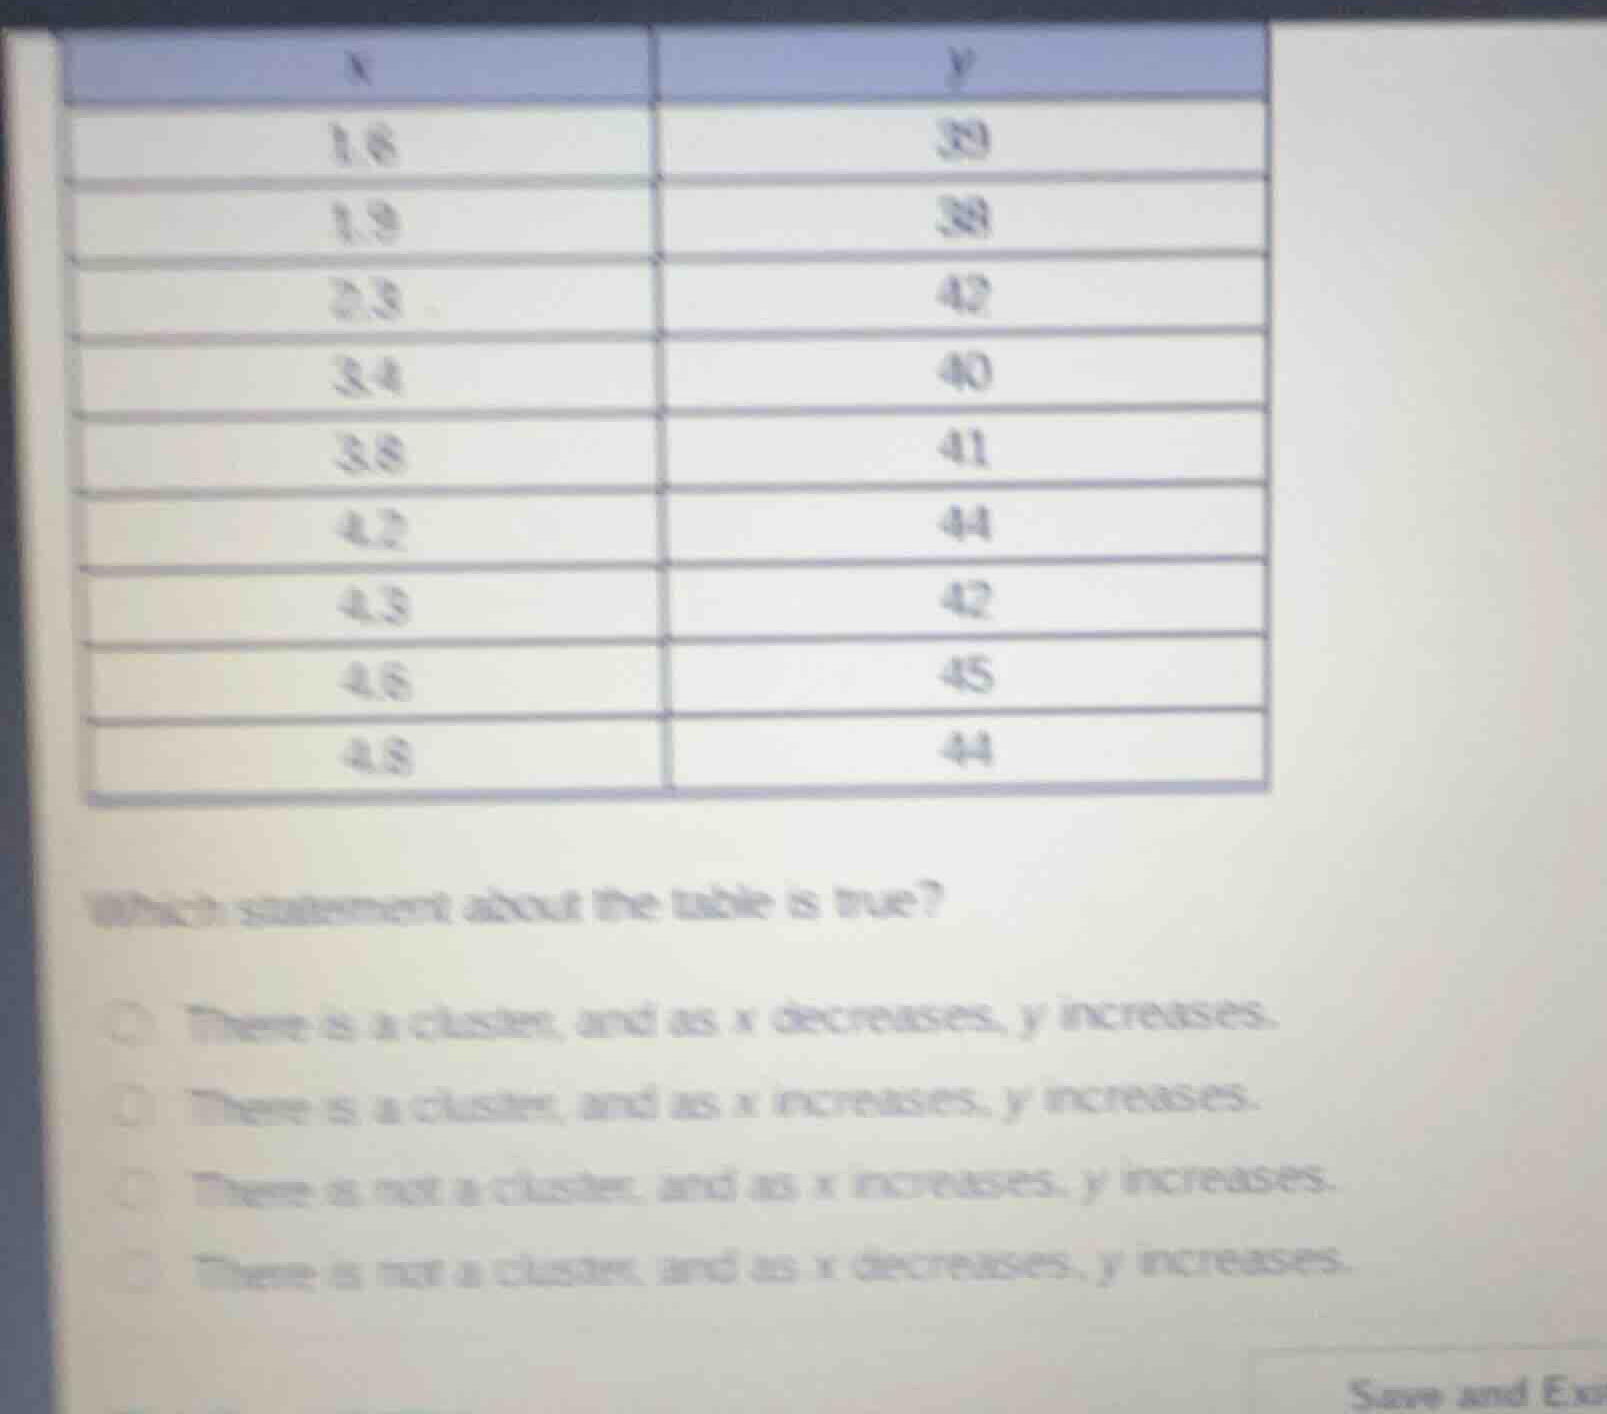
- \(x = 1.6, y = 39\)
- \(x = 1.9, y = 38\)
- \(x = 2.3, y = 42\)
- \(x = 3.4, y = 40\)
- \(x = 3.8, y = 41\)
- \(x = 4.2, y = 44\)
- \(x = 4.3, y = 42\)
- \(x = 4.6, y = 45\)
- \(x = 4.8, y = 44\)
As \(x\) increases from \(1.6\) to \(4.8\), \(y\) generally increases from around \(38\text{–}39\) to \(44\text{–}45\). This indicates a positive association: as \(x\) increases, \(y\) increases.
Analyze the presence of clusters
A cluster is a distinct group of data points that are grouped closely together, separated from other data points.
The \(x\)-values are relatively evenly distributed across the interval from \(1.6\) to \(4.8\) without any distinct, isolated groupings or large gaps. Thus, there is not a cluster in this dataset.
Select the correct statement
Combining the two findings:
- There is not a cluster.
- As \(x\) increases, \(y\) increases.
This matches the third option.

Snap & solve any problem in the app
Get step-by-step solutions on Sovi AI
Photo-based solutions with guided steps
Explore more problems and detailed explanations
- (A) There is a cluster, and as x decreases, y increases.
- (B) There is a cluster, and as x increases, y increases.
- (C) There is not a cluster, and as x increases, y increases. (Correct answer)
- (D) There is not a cluster, and as x decreases, y increases.