QUESTION IMAGE
Question
Question was provided via image upload.
Identify the context and questions
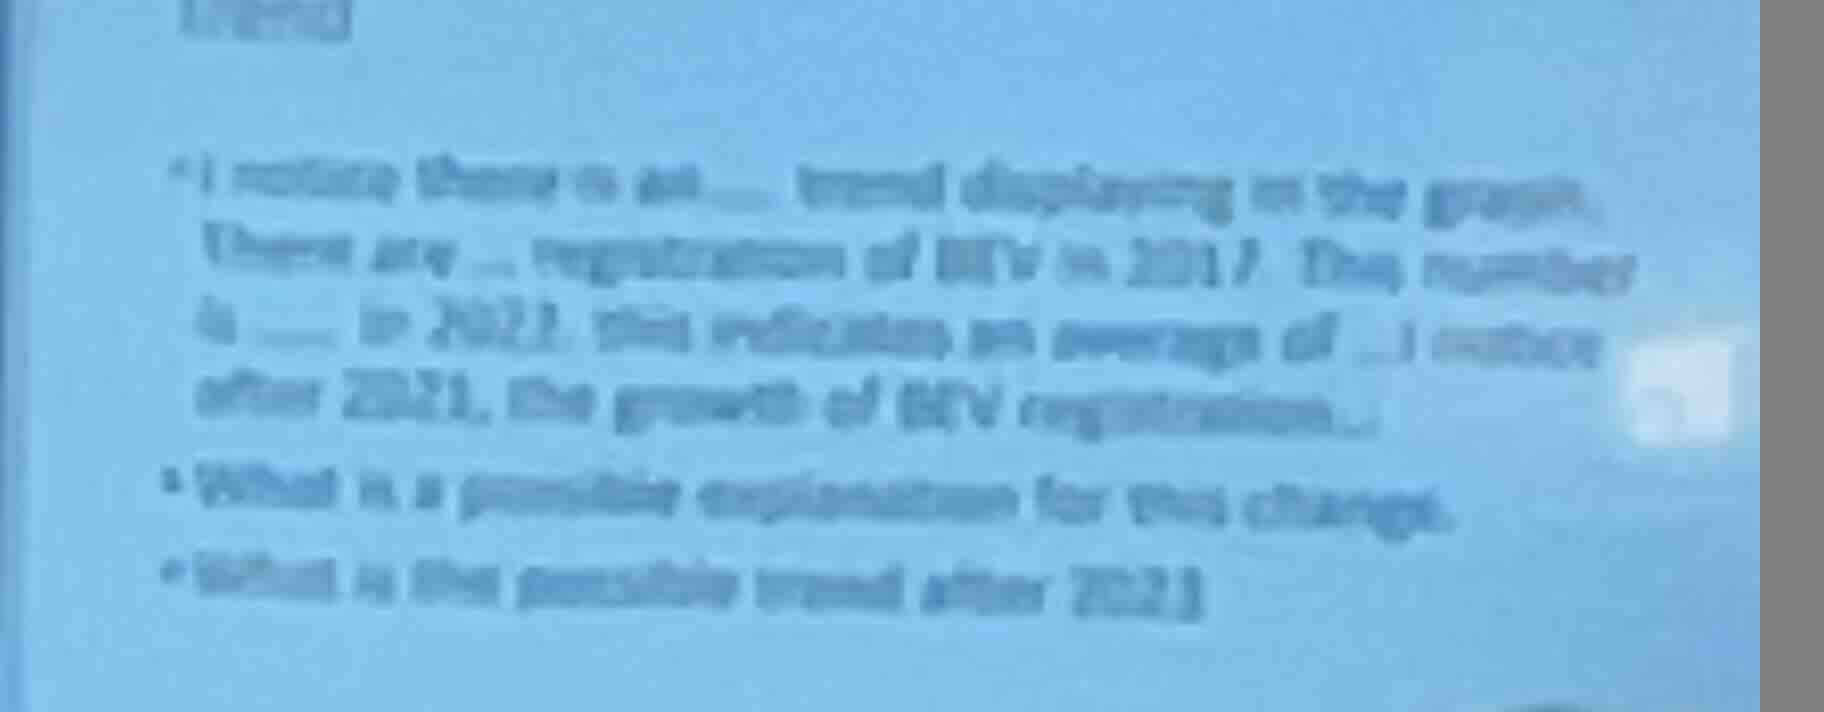
The image contains three bullet points analyzing a graph of Battery Electric Vehicle (BEV) registrations:
- A fill-in-the-blank observation: "I notice there is an _ trend displaying in the graph. There are _ registration of BEV in 2017. The number is ___ in 2022, this indicates an average of ... I notice after 2021, the growth of BEV registration..."
- "What is a possible explanation for this change?"
- "What is the possible trend after 2023?"
Since the actual graph and exact numerical data are not visible in the blurry image, we will provide a structured framework to complete these prompts using typical real-world BEV registration trends (which show rapid upward exponential growth over this period) and statistical reasoning.
Analyze the trend and fill-in-the-blank structure
Using Statistical Investigation principles, we describe the overall pattern:
- The overall trend of BEV registrations from 2017 to 2022 is upward/increasing.
- In 2017, BEV registrations were relatively low.
- By 2022, registrations increased significantly (showing rapid growth).
- After 2021, the growth rate typically accelerated or became steeper.
Formulate explanations for the change
We explain the underlying factors causing this upward shift:
- Government incentives, subsidies, and policies promoting electric vehicles.
- Increased environmental awareness among consumers.
- Improvements in EV technology (longer battery range, more charging infrastructure).
- More vehicle models offered by manufacturers.
Predict the future trend after 2023
We project the future trend based on current momentum:
- The trend is highly likely to continue increasing as production scales up and fossil-fuel vehicle phase-outs approach.
- Alternatively, it may begin to stabilize (follow an S-curve/logistic growth) as the market reaches saturation.

Snap & solve any problem in the app
Get step-by-step solutions on Sovi AI
Photo-based solutions with guided steps
Explore more problems and detailed explanations
Question 1
- "I notice there is an increasing/upward trend displaying in the graph. There are low registration of BEV in 2017. The number is significantly higher in 2022, this indicates an average of steady annual growth. I notice after 2021, the growth of BEV registration accelerated rapidly."
Question 2
- Possible explanation: The rapid increase in BEV registrations is driven by government policies (such as tax incentives and subsidies), expanding public charging infrastructure, improvements in battery range, and a wider variety of electric vehicle models available to consumers.
Question 3
- Possible trend after 2023: The trend is expected to continue upward as global transition targets approach, potentially transitioning into a logistic (S-curve) growth pattern as the market approaches saturation.