QUESTION IMAGE
Question
Question was provided via image upload.
Analyze the missing context
The prompt asks to match each scenario to a graph, but the graphs are not visible in the cropped image. Standard supply and demand analysis involves four primary shifts:
- Increase in Demand (Demand curve shifts right)
- Decrease in Demand (Demand curve shifts left)
- Increase in Supply (Supply curve shifts right)
- Decrease in Supply (Supply curve shifts left)
We will identify the exact economic shift for each of the six statements.
Analyze statement 1
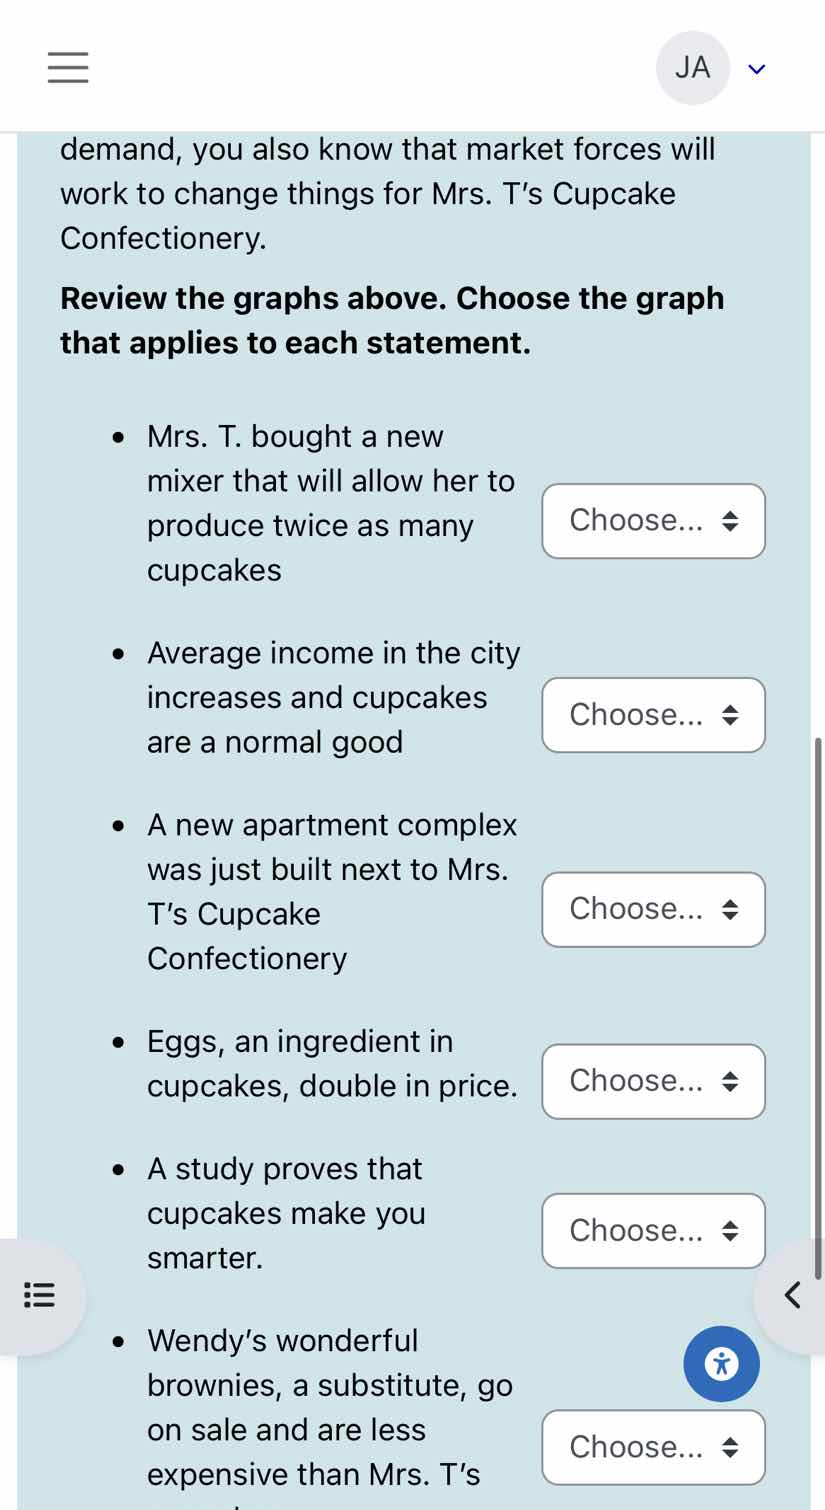
Statement: "Mrs. T. bought a new mixer that will allow her to produce twice as many cupcakes"
Analysis: This represents an improvement in technology, which reduces production costs.
Shift: Increase in Supply (Supply curve shifts right).
Analyze statements 2 and 3
Statement 2: "Average income in the city increases and cupcakes are a normal good"
Analysis: An increase in consumer income for a normal good increases consumer willingness and ability to buy.
Shift: Increase in Demand (Demand curve shifts right).
Statement 3: "A new apartment complex was just built next to Mrs. T's Cupcake Confectionery"
Analysis: This increases the number of buyers (population/market size) in the immediate area.
Shift: Increase in Demand (Demand curve shifts right).
Analyze statement 4
Statement: "Eggs, an ingredient in cupcakes, double in price."
Analysis: Eggs are an input/resource. An increase in input prices increases production costs, making production less profitable.
Shift: Decrease in Supply (Supply curve shifts left).
Analyze statements 5 and 6
Statement 5: "A study proves that cupcakes make you smarter."
Analysis: This positively changes consumer tastes and preferences toward cupcakes.
Shift: Increase in Demand (Demand curve shifts right).
Statement 6: "Wendy's wonderful brownies, a substitute, go on sale and are less expensive than Mrs. T's"
Analysis: When the price of a substitute good falls, consumers switch to the cheaper substitute, reducing demand for the original good.
Shift: Decrease in Demand (Demand curve shifts left).

Snap & solve any problem in the app
Get step-by-step solutions on Sovi AI
Photo-based solutions with guided steps
Explore more problems and detailed explanations
Since the reference graphs are cropped out of the image, here are the standard economic shifts that apply to each statement:
- Mrs. T. bought a new mixer that will allow her to produce twice as many cupcakes
- Economic Shift: Increase in Supply (Supply curve shifts right)
- Average income in the city increases and cupcakes are a normal good
- Economic Shift: Increase in Demand (Demand curve shifts right)
- A new apartment complex was just built next to Mrs. T's Cupcake Confectionery
- Economic Shift: Increase in Demand (Demand curve shifts right)
- Eggs, an ingredient in cupcakes, double in price.
- Economic Shift: Decrease in Supply (Supply curve shifts left)
- A study proves that cupcakes make you smarter.
- Economic Shift: Increase in Demand (Demand curve shifts right)
- Wendy's wonderful brownies, a substitute, go on sale and are less expensive than Mrs. T's
- Economic Shift: Decrease in Demand (Demand curve shifts left)