QUESTION IMAGE
Question
Question was provided via image upload.
Identify the graph type
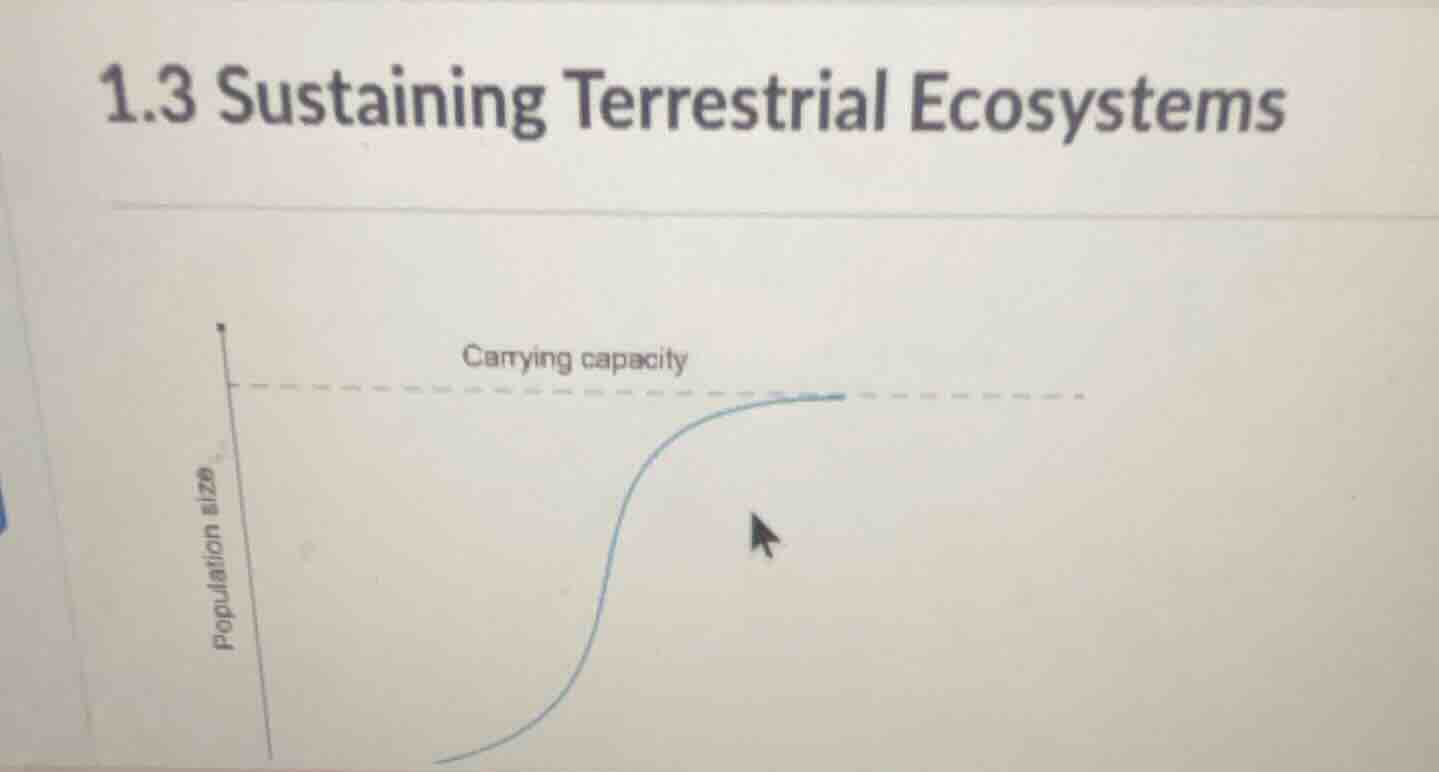
The image shows a population growth curve that levels off at a dashed line labeled "Carrying capacity." This S-shaped pattern represents logistic population growth, a fundamental concept in Terrestrial Ecosystems.
Analyze the growth phases
Initially, the population size increases slowly, then undergoes rapid exponential growth, and finally decelerates as it approaches the carrying capacity.
Define carrying capacity
The carrying capacity is the maximum population size of a species that a given environment can sustain indefinitely, determined by Carrying Capacity Dynamics and limiting factors.
Determine the question context
Under the topic "1.3 Sustaining Terrestrial Ecosystems," this diagram typically asks students to identify the type of growth model shown (logistic growth) or describe what happens as the population reaches carrying capacity.

Snap & solve any problem in the app
Get step-by-step solutions on Sovi AI
Photo-based solutions with guided steps
Explore more problems and detailed explanations
The image displays a logistic growth curve (an S-shaped curve) representing how a population grows in a terrestrial ecosystem until it reaches its carrying capacity, where resource limitations stabilize the population size.