QUESTION IMAGE
Question
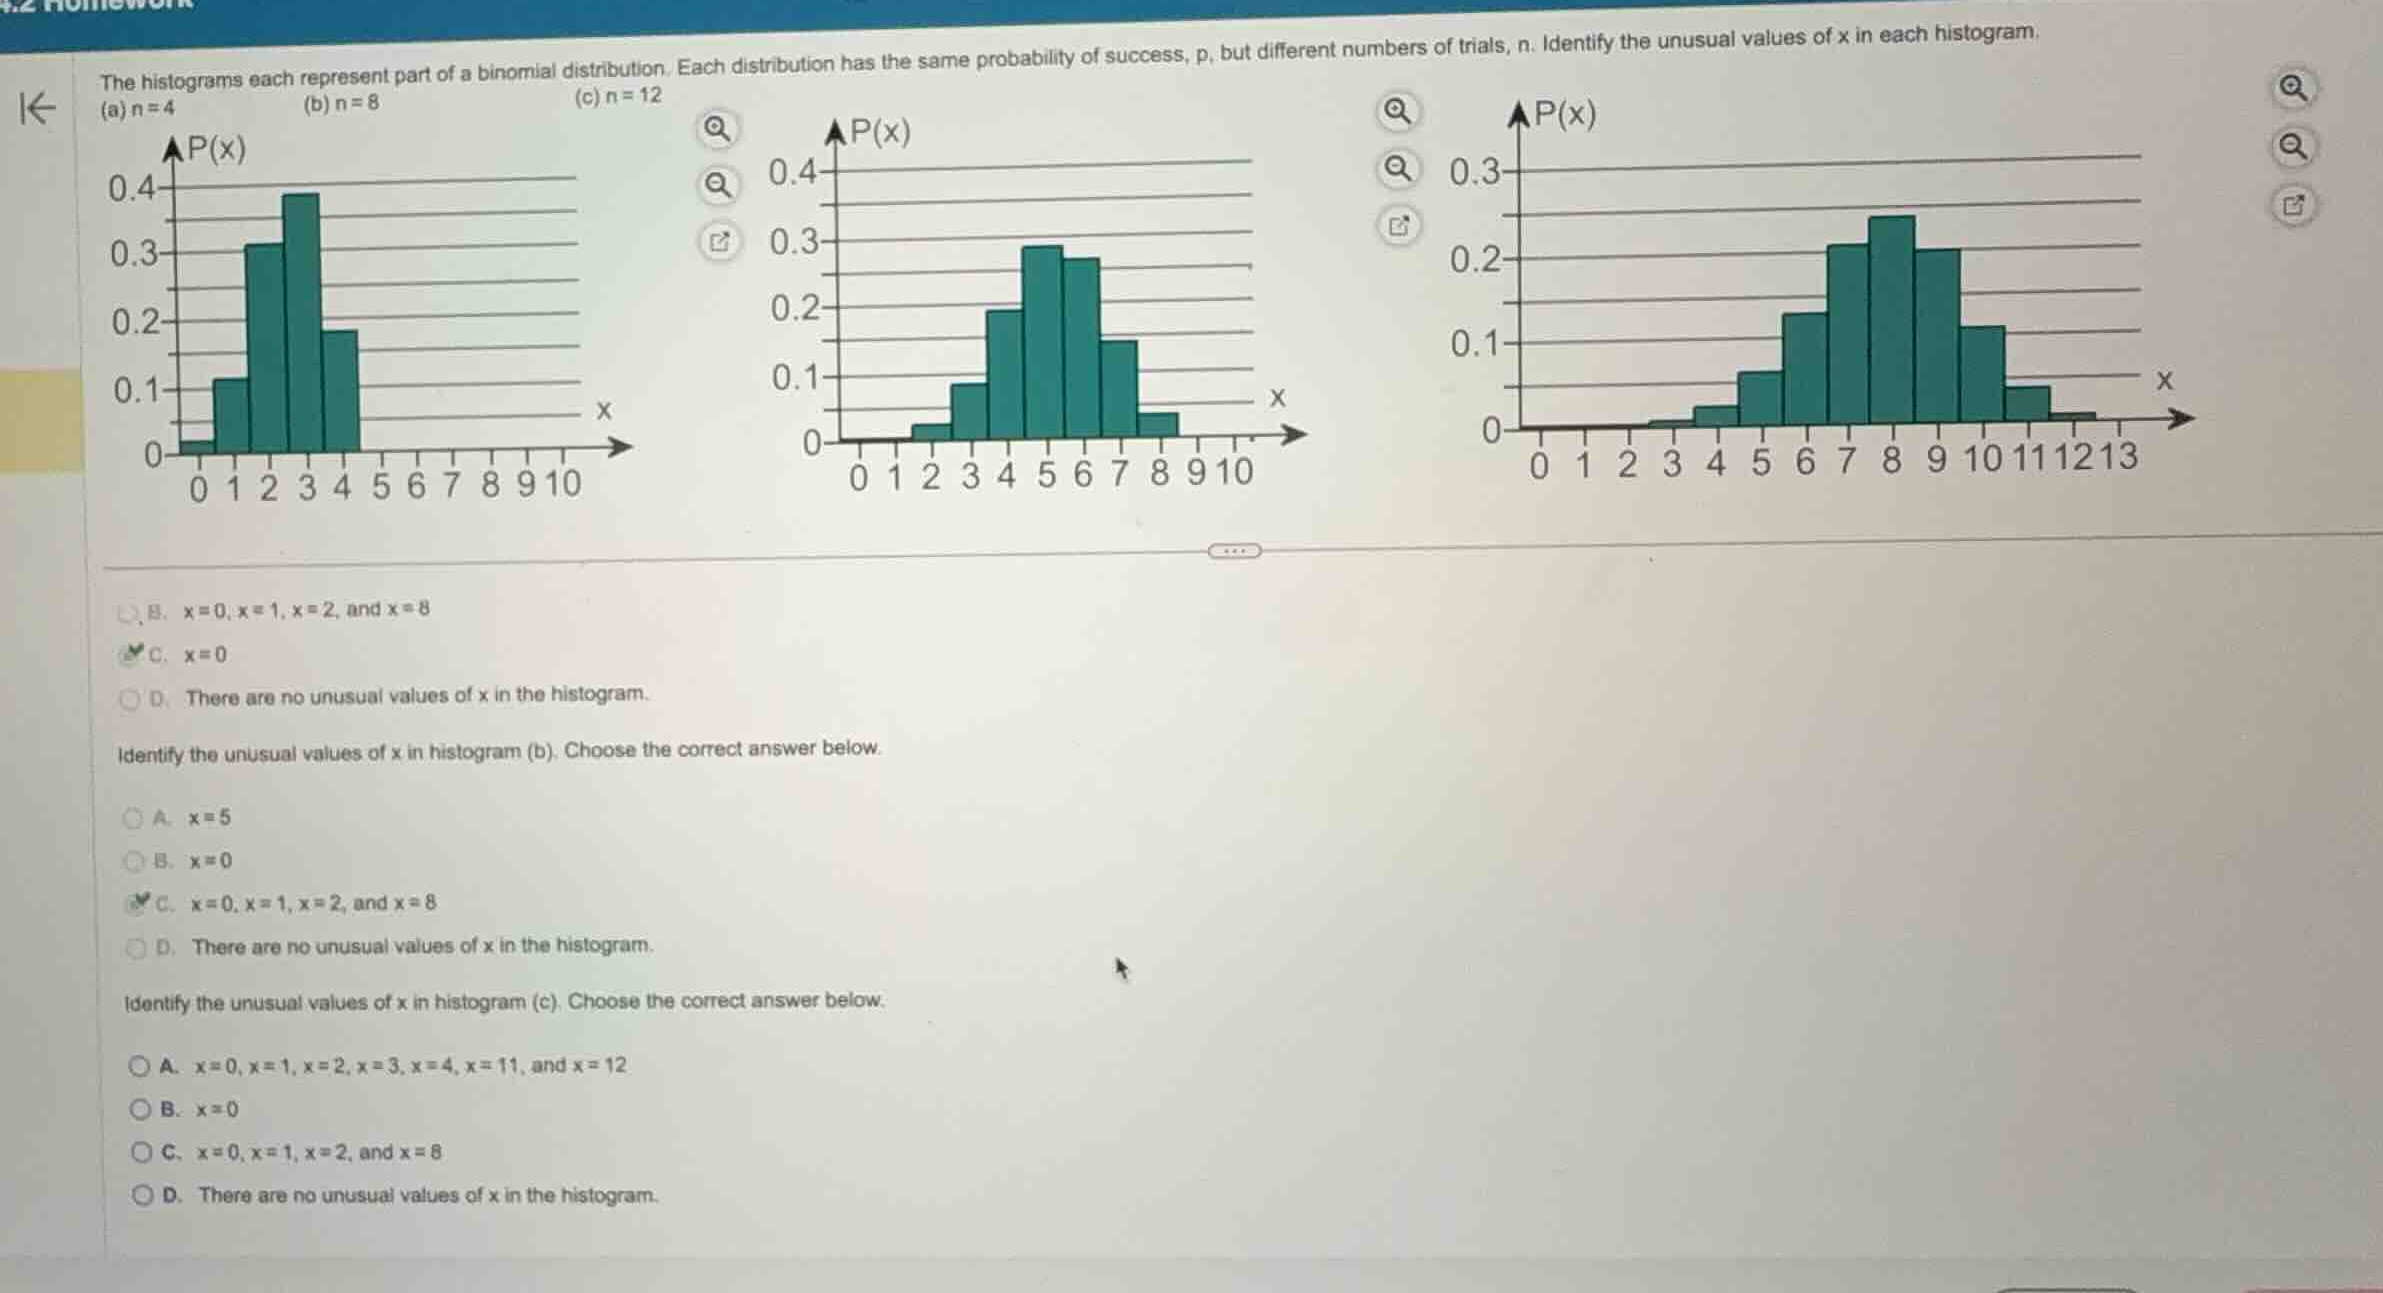
the histograms each represent part of a binomial distribution. each distribution has the same probability of success, p, but different numbers of trials, n. identify the unusual values of x in each histogram.
(a) n = 4
(b) n = 8
(c) n = 12
identify the unusual values of x in histogram (b). choose the correct answer below.
a. x = 5
b. x = 0
c. x = 0, x = 1, x = 2, and x = 8
d. there are no unusual values of x in the histogram.
identify the unusual values of x in histogram (c). choose the correct answer below.
a. x = 0, x = 1, x = 2, x = 3, x = 4, x = 11, and x = 12
b. x = 0
c. x = 0, x = 1, x = 2, and x = 8
d. there are no unusual values of x in the histogram.
Define unusual values in probability distributions
An unusual value in a probability distribution is typically defined as an outcome \(x\) with a probability of occurrence less than or equal to \(0.05\) (i.e., \(P(x) \le 0.05\)).
Analyze histogram (a) where \(n = 4\)
Looking at the first histogram for \(n = 4\):
- \(P(0) \le 0.05\) (the bar is below the \(0.05\) level)
- \(P(1) \approx 0.11 > 0.05\)
- \(P(2) \approx 0.31 > 0.05\)
- \(P(3) \approx 0.39 > 0.05\)
- \(P(4) \approx 0.19 > 0.05\)
- For \(x \ge 5\), the values are outside the range of possible trials since \(n = 4\).
Thus, the only unusual value is \(x = 0\).
Analyze histogram (b) where \(n = 8\)
Looking at the second histogram for \(n = 8\):
- \(P(0) \le 0.05\) (no visible bar, so \(P(0) \approx 0 \le 0.05\))
- \(P(1) \le 0.05\) (no visible bar, so \(P(1) \approx 0 \le 0.05\))
- \(P(2) \le 0.05\) (the bar is below the \(0.05\) level)
- \(P(3) \approx 0.08 > 0.05\)
- \(P(4) \approx 0.19 > 0.05\)
- \(P(5) \approx 0.29 > 0.05\)
- \(P(6) \approx 0.27 > 0.05\)
- \(P(7) \approx 0.14 > 0.05\)
- \(P(8) \le 0.05\) (the bar is below the \(0.05\) level)
- For \(x \ge 9\), the values are outside the range of possible trials since \(n = 8\).
Thus, the unusual values are \(x = 0\), \(x = 1\), \(x = 2\), and \(x = 8\).
Analyze histogram (c) where \(n = 12\)
Looking at the third histogram for \(n = 12\):
- \(P(0), P(1), P(2), P(3), P(4) \le 0.05\) (bars are either non-existent or below \(0.05\))
- \(P(5) \approx 0.06 > 0.05\)
- \(P(6) \approx 0.13 > 0.05\)
- \(P(7) \approx 0.21 > 0.05\)
- \(P(8) \approx 0.25 > 0.05\)
- \(P(9) \approx 0.20 > 0.05\)
- \(P(10) \approx 0.11 > 0.05\)
- \(P(11) \le 0.05\) (the bar is below the \(0.05\) level)
- \(P(12) \le 0.05\) (the bar is below the \(0.05\) level)
Thus, the unusual values are \(x = 0\), \(x = 1\), \(x = 2\), \(x = 3\), \(x = 4\), \(x = 11\), and \(x = 12\).

Snap & solve any problem in the app
Get step-by-step solutions on Sovi AI
Photo-based solutions with guided steps
Explore more problems and detailed explanations
Question 1
- A. \(x = 0, x = 1, x = 2\), and \(x = 8\)
- B. \(x = 0\) (Correct answer)
- C. There are no unusual values of x in the histogram.
Question 2
- A. \(x = 5\)
- B. \(x = 0\)
- C. \(x = 0, x = 1, x = 2\), and \(x = 8\) (Correct answer)
- D. There are no unusual values of x in the histogram.
Question 3
- A. \(x = 0, x = 1, x = 2, x = 3, x = 4, x = 11\), and \(x = 12\) (Correct answer)
- B. \(x = 0\)
- C. \(x = 0, x = 1, x = 2\), and \(x = 8\)
- D. There are no unusual values of x in the histogram.