QUESTION IMAGE
Question
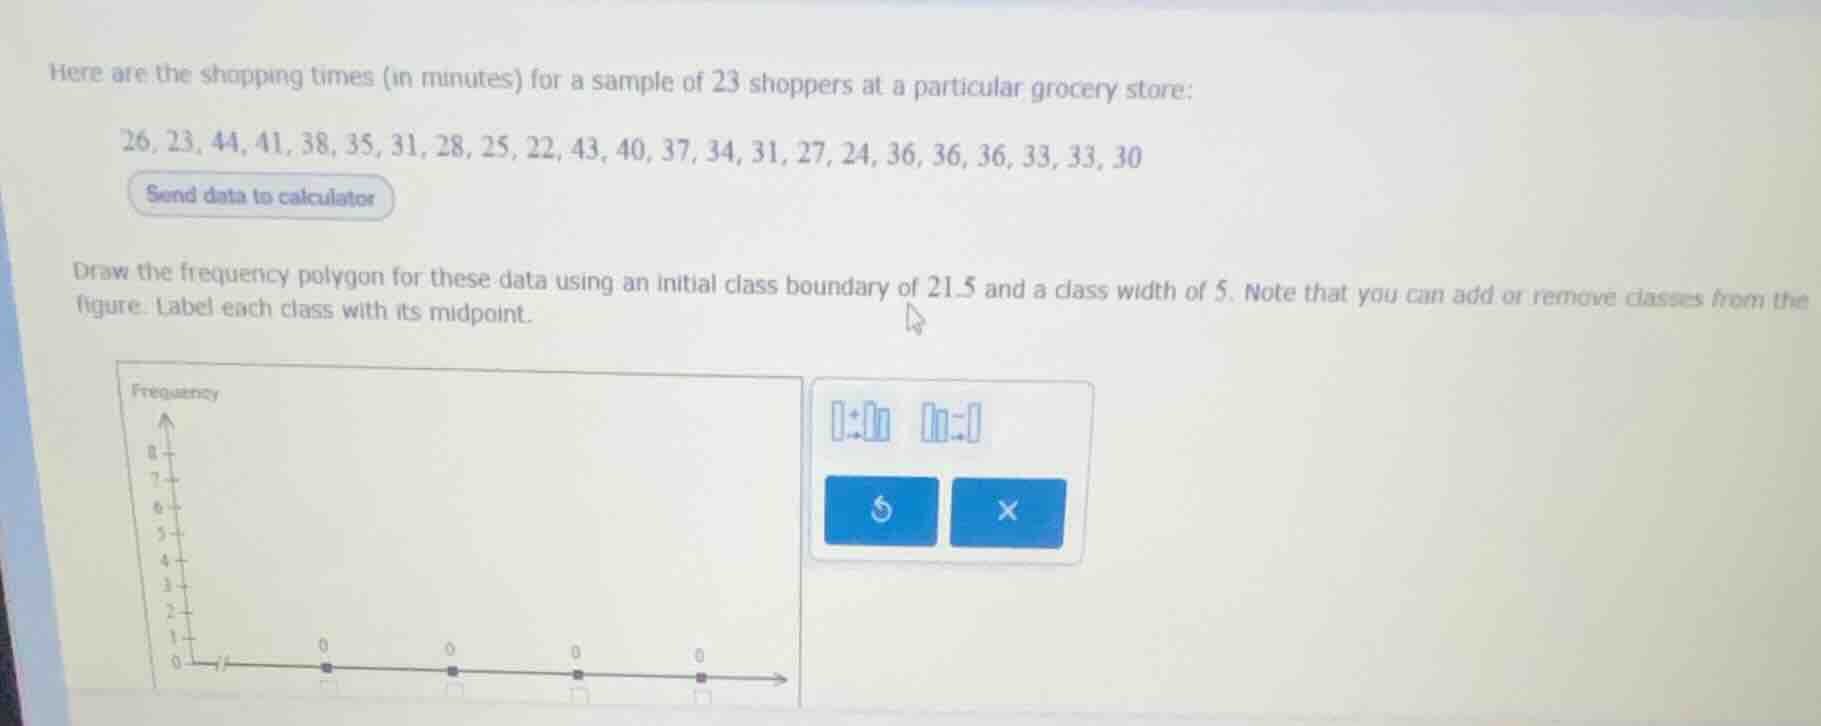
here are the shopping times (in minutes) for a sample of 23 shoppers at a particular grocery store:
26, 23, 44, 41, 38, 35, 31, 28, 25, 22, 43, 40, 37, 34, 31, 27, 24, 36, 36, 36, 33, 33, 30
draw the frequency polygon for these data using an initial class boundary of 21.5 and a class width of 5. note that you can add or remove classes from the figure. label each class with its midpoint.
<pre_analysis>
{
"quality": "clear",
"question_count": 1,
"skills_matched": [
"step_cot",
"explain_then_answer",
"quick"
],
"needs_drawing": true,
"concepts_used": [
"Frequency Polygon",
"Class Midpoint",
"Class Boundaries"
],
"new_concepts": [],
"current_concepts": [
"Frequency Polygon",
"Class Midpoint",
"Class Boundaries",
"Frequency Distribution"
]
}
</pre_analysis>
<reasoning>
Determine class intervals and midpoints
\[
\]
Count frequencies for each class
\[
\]
Construct frequency polygon coordinates
\[
\]
</reasoning>
<answer>
To construct the frequency polygon, label the horizontal axis with the class midpoints and plot the corresponding frequencies. The polygon must start and end on the horizontal axis (frequency of 0) at the midpoints of the empty classes immediately preceding and following the data classes.
Class Midpoints and Frequencies:
- Anchor Point (Start): Midpoint = \(19\), Frequency = \(0\)
- Class 1 (21.5 – 26.5): Midpoint = \(24\), Frequency = \(5\)
- Class 2 (26.5 – 31.5): Midpoint = \(29\), Frequency = \(5\)
- Class 3 (31.5 – 36.5): Midpoint = \(34\), Frequency = \(7\)
- Class 4 (36.5 – 41.5): Midpoint = \(39\), Frequency = \(4\)
- Class 5 (41.5 – 46.5): Midpoint = \(44\), Frequency = \(2\)
- Anchor Point (End): Midpoint = \(49\), Frequency = \(0\)
Plotting Coordinates:
Plot and connect the following points in order:
\[
(19, 0)
ightarrow (24, 5)
ightarrow (29, 5)
ightarrow (34, 7)
ightarrow (39, 4)
ightarrow (44, 2)
ightarrow (49, 0)
\]
</answer>
<plot>
{
"elements": [
{
"type": "point",
"params": [[19, 0]],
"properties": {
"name": "(19,0)",
"size": 3,
"color": "#8C55F2",
"withLabel": true
}
},
{
"type": "point",
"params": [[24, 5]],
"properties": {
"name": "(24,5)",
"size": 3,
"color": "#8C55F2",
"withLabel": true
}
},
{
"type": "point",
"params": [[29, 5]],
"properties": {
"name": "(29,5)",
"size": 3,
"color": "#8C55F2",
"withLabel": true
}
},
{
"type": "point",
"params": [[34, 7]],
"properties": {…

Snap & solve any problem in the app
Get step-by-step solutions on Sovi AI
Photo-based solutions with guided steps
Explore more problems and detailed explanations
<pre_analysis>
{
"quality": "clear",
"question_count": 1,
"skills_matched": [
"step_cot",
"explain_then_answer",
"quick"
],
"needs_drawing": true,
"concepts_used": [
"Frequency Polygon",
"Class Midpoint",
"Class Boundaries"
],
"new_concepts": [],
"current_concepts": [
"Frequency Polygon",
"Class Midpoint",
"Class Boundaries",
"Frequency Distribution"
]
}
</pre_analysis>
<reasoning>
Determine class intervals and midpoints
\[
\]
Count frequencies for each class
\[
\]
Construct frequency polygon coordinates
\[
\]
</reasoning>
<answer>
To construct the frequency polygon, label the horizontal axis with the class midpoints and plot the corresponding frequencies. The polygon must start and end on the horizontal axis (frequency of 0) at the midpoints of the empty classes immediately preceding and following the data classes.
Class Midpoints and Frequencies:
- Anchor Point (Start): Midpoint = \(19\), Frequency = \(0\)
- Class 1 (21.5 – 26.5): Midpoint = \(24\), Frequency = \(5\)
- Class 2 (26.5 – 31.5): Midpoint = \(29\), Frequency = \(5\)
- Class 3 (31.5 – 36.5): Midpoint = \(34\), Frequency = \(7\)
- Class 4 (36.5 – 41.5): Midpoint = \(39\), Frequency = \(4\)
- Class 5 (41.5 – 46.5): Midpoint = \(44\), Frequency = \(2\)
- Anchor Point (End): Midpoint = \(49\), Frequency = \(0\)
Plotting Coordinates:
Plot and connect the following points in order:
\[
(19, 0)
ightarrow (24, 5)
ightarrow (29, 5)
ightarrow (34, 7)
ightarrow (39, 4)
ightarrow (44, 2)
ightarrow (49, 0)
\]
</answer>
<plot>
{
"elements": [
{
"type": "point",
"params": [[19, 0]],
"properties": {
"name": "(19,0)",
"size": 3,
"color": "#8C55F2",
"withLabel": true
}
},
{
"type": "point",
"params": [[24, 5]],
"properties": {
"name": "(24,5)",
"size": 3,
"color": "#8C55F2",
"withLabel": true
}
},
{
"type": "point",
"params": [[29, 5]],
"properties": {
"name": "(29,5)",
"size": 3,
"color": "#8C55F2",
"withLabel": true
}
},
{
"type": "point",
"params": [[34, 7]],
"properties": {
"name": "(34,7)",
"size": 3,
"color": "#8C55F2",
"withLabel": true
}
},
{
"type": "point",
"params": [[39, 4]],
"properties": {
"name": "(39,4)",
"size": 3,
"color": "#8C55F2",
"withLabel": true
}
},
{
"type": "point",
"params": [[44, 2]],
"properties": {
"name": "(44,2)",
"size": 3,
"color": "#8C55F2",
"withLabel": true
}
},
{
"type": "point",
"params": [[49, 0]],
"properties": {
"name": "(49,0)",
"size": 3,
"color": "#8C55F2",
"withLabel": true
}
},
{
"type": "segment",
"params": [[19, 0], [24, 5]],
"properties": {
"strokeColor": "#8C55F2",
"strokeWidth": 2
}
},
{
"type": "segment",
"params": [[24, 5], [29, 5]],
"properties": {
"strokeColor": "#8C55F2",
"strokeWidth": 2
}
},
{
"type": "segment",
"params": [[29, 5], [34, 7]],
"properties": {
"strokeColor": "#8C55F2",
"strokeWidth": 2
}
},
{
"type": "segment",
"params": [[34, 7], [39, 4]],
"properties": {
"strokeColor": "#8C55F2",
"strokeWidth": 2
}
},
{
"type": "segment",
"params": [[39, 4], [44, 2]],
"properties": {
"strokeColor": "#8C55F2",
"strokeWidth": 2
}
},
{
"type": "segment",
"params": [[44, 2], [49, 0]],
"properties": {
"strokeColor": "#8C55F2",
"strokeWidth": 2
}
}
]
}
</plot>
<post_analysis>
{
"subject": "Mathematics",
"question_type": "Free Response",
"knowledge_point": [
"Mathematics",
"Statistics",
"Frequency Polygon"
]
}
</post_analysis>