QUESTION IMAGE
Question
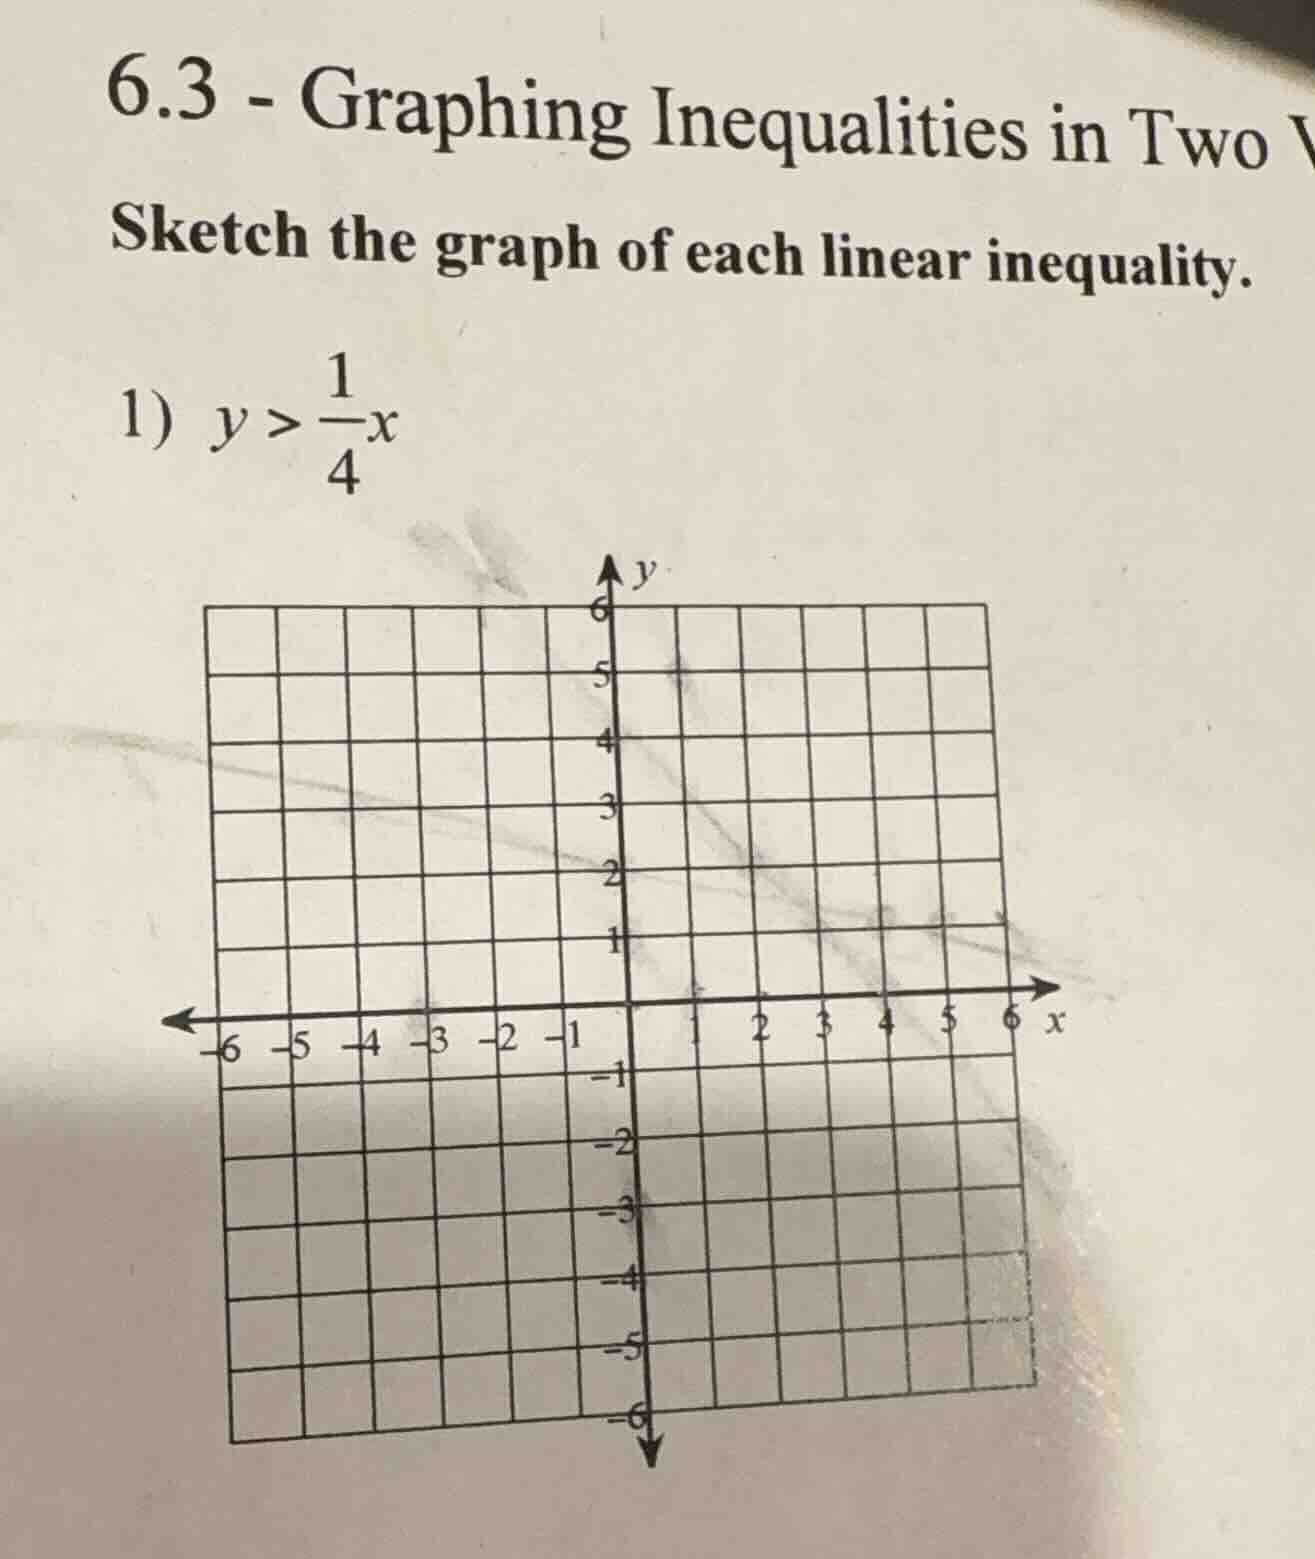
6.3 - graphing inequalities in two \
sketch the graph of each linear inequality.\
- $y > \frac{1}{4}x$\
graph with x-axis from -6 to 6 and y-axis from -6 to 6, grid lines
Step1: Graph the boundary line
First, we consider the equation \( y=\frac{1}{4}x \). This is a linear equation in slope - intercept form (\( y = mx + b \)) where the slope \( m=\frac{1}{4} \) and the y - intercept \( b = 0 \). Since the inequality is \( y>\frac{1}{4}x \) (not \( y\geq\frac{1}{4}x \)), we draw a dashed line for \( y = \frac{1}{4}x \). To graph the line, we can use the slope. From the origin (since \( b = 0 \)), we move up 1 unit and then 4 units to the right (because slope \(=\frac{\text{rise}}{\text{run}}=\frac{1}{4}\)) to get another point, say \( (4,1) \), and then draw the dashed line through these points.
Step2: Determine the region to shade
We need to test a point that is not on the line \( y=\frac{1}{4}x \). A common test point is the origin \( (0,0) \). Substitute \( x = 0 \) and \( y = 0 \) into the inequality \( y>\frac{1}{4}x \). We get \( 0>\frac{1}{4}(0) \), which simplifies to \( 0 > 0 \), and this is false. So we do not shade the region that contains the origin. We shade the region above the dashed line \( y=\frac{1}{4}x \) (because when the test point at the origin gives a false statement, we shade the opposite region of the origin with respect to the line).
To summarize the graphing steps:
- Draw a dashed line \( y=\frac{1}{4}x \) (dashed because the inequality is strict, \( y>\frac{1}{4}x \) not \( y\geq\frac{1}{4}x \)).
- Test the origin \( (0,0) \): \( 0>\frac{1}{4}(0)\) is false.
- Shade the region above the dashed line \( y = \frac{1}{4}x \).
(Note: Since this is a graphing problem, the final answer is the graph with a dashed line \( y=\frac{1}{4}x \) and the region above the line shaded. If we were to describe the key features: dashed line with slope \( \frac{1}{4} \), y - intercept 0, and shading above the line.)

Snap & solve any problem in the app
Get step-by-step solutions on Sovi AI
Photo-based solutions with guided steps
Explore more problems and detailed explanations
The graph has a dashed line \( y=\frac{1}{4}x \) (passing through \((0,0)\) and \((4,1)\) etc.) and the region above this dashed line is shaded.