QUESTION IMAGE
Question
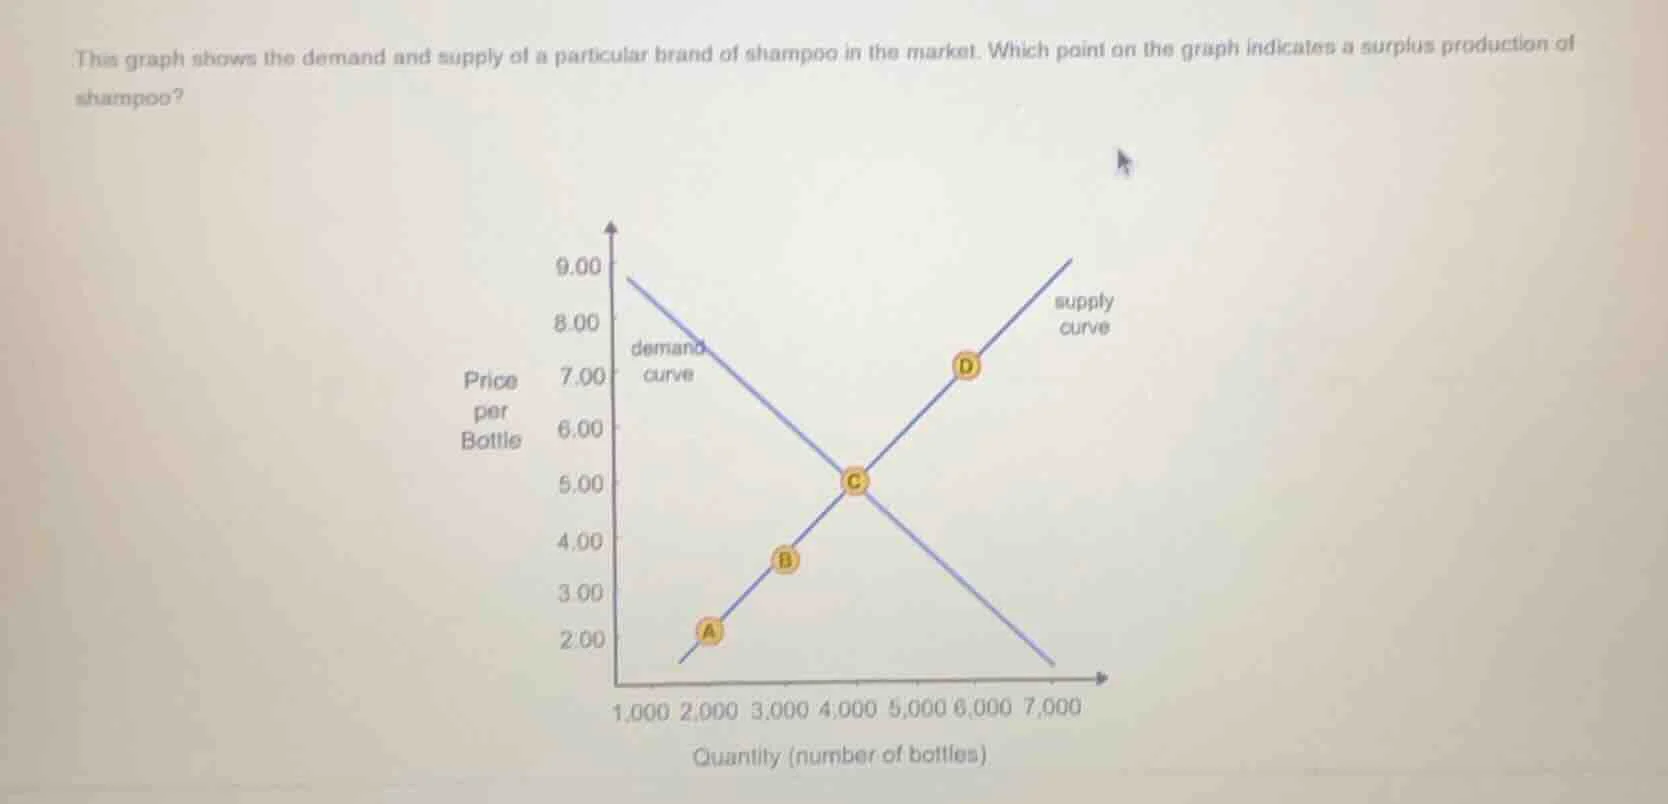
this graph shows the demand and supply of a particular brand of shampoo in the market. which point on the graph indicates a surplus production of shampoo? graph with demand curve, supply curve, points a, b, c, d, axes: price per bottle (y) and quantity (number of bottles) (x)
Step1: Recall surplus definition
A surplus occurs when supply > demand, i.e., at a price where quantity supplied exceeds quantity demanded. This happens above the equilibrium price (where demand and supply curves intersect, point C here).
Step2: Analyze each point
- Point A: On supply curve, low price, supply < demand (since demand curve at same quantity would have higher price, meaning more demand).
- Point B: On supply curve, still below equilibrium (C), so supply < demand.
- Point C: Equilibrium, supply = demand.
- Point D: On supply curve, price above equilibrium (C's price ~5, D's price ~7). At this price, quantity supplied (6000) is more than quantity demanded (demand curve at quantity 6000 has lower price, so less demand). Thus, supply > demand here.

Snap & solve any problem in the app
Get step-by-step solutions on Sovi AI
Photo-based solutions with guided steps
Explore more problems and detailed explanations
D (the point D on the supply curve, where quantity supplied exceeds quantity demanded)