QUESTION IMAGE
Question
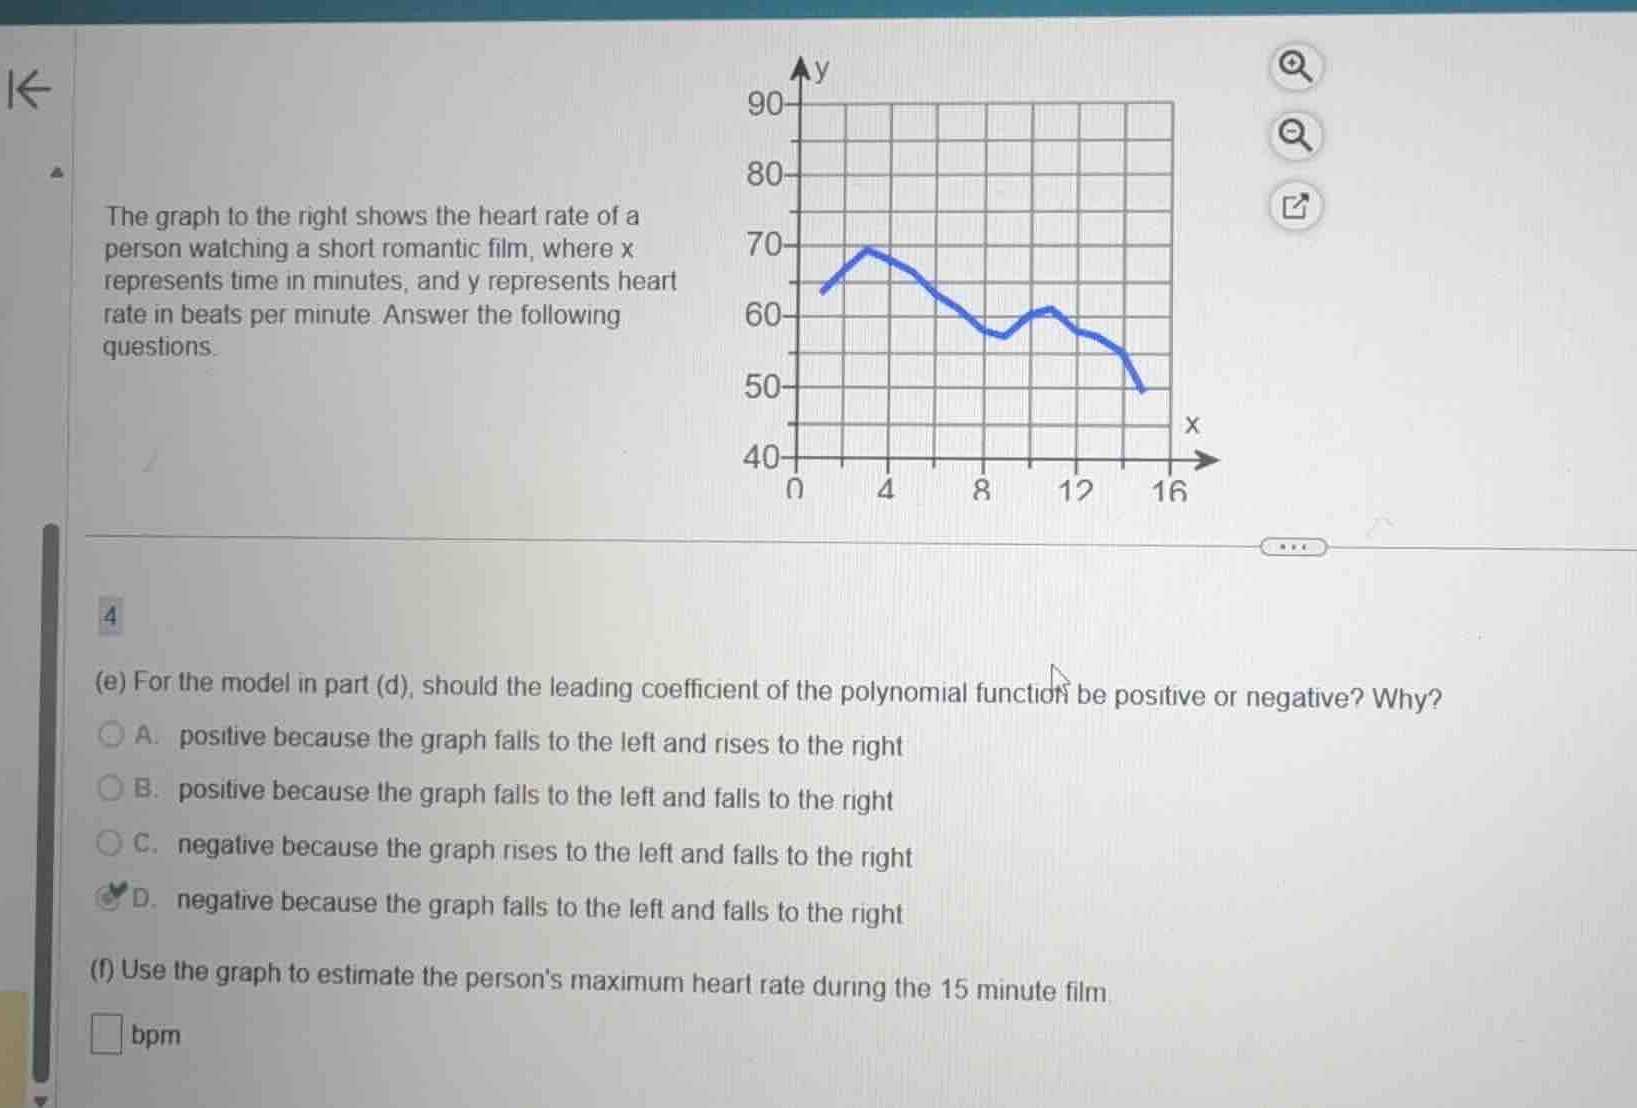
the graph to the right shows the heart rate of a person watching a short romantic film, where x represents time in minutes, and y represents heart rate in beats per minute. answer the following questions.
(e) for the model in part (d), should the leading coefficient of the polynomial function be positive or negative? why?
a. positive because the graph falls to the left and rises to the right
b. positive because the graph falls to the left and falls to the right
c. negative because the graph rises to the left and falls to the right
d. negative because the graph falls to the left and falls to the right
(f) use the graph to estimate the persons maximum heart rate during the 15 minute film.
bpm
Analyze end behavior of the polynomial model
Using the Leading Coefficient Test and End Behavior of Polynomials knowledge points
Estimate the maximum heart rate from the graph
Using the Graph Interpretation knowledge point

Snap & solve any problem in the app
Get step-by-step solutions on Sovi AI
Photo-based solutions with guided steps
Explore more problems and detailed explanations
Question (e)
- A. positive because the graph falls to the left and rises to the right
- B. positive because the graph falls to the left and falls to the right
- C. negative because the graph rises to the left and falls to the right
- D. negative because the graph falls to the left and falls to the right (Correct answer)
Question (f)
<blank>69</blank> bpm