QUESTION IMAGE
Question
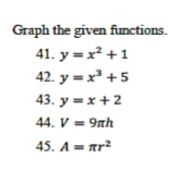
graph the given functions.
- (y = x^2 + 1)
- (y = x^3 + 5)
- (y = x + 2)
- (v = 9pi h)
- (a = pi r^2)
⚡ Using what you learned: representing functions (tables, graphs, equations, mappings)
Step 1: Graph of \( y = x^2 + 1 \)
This is a quadratic function. The parent function \( y = x^2 \) is a parabola opening upwards with its vertex at \( (0,0) \). Adding \( 1 \) shifts the entire graph vertically upward by \( 1 \) unit.
- Vertex: \( (0, 1) \)
- Key Points: \( (-2, 5) \), \( (-1, 2) \), \( (0, 1) \), \( (1, 2) \), \( (2, 5) \)
---
Step 2: Graph of \( y = x^3 + 5 \)
This is a cubic function. The parent function \( y = x^3 \) has an S-shaped curve passing through the origin. Adding \( 5 \) shifts the inflection point vertically upward by \( 5 \) units.
- Inflection Point: \( (0, 5) \)
- Key Points: \( (-2, -3) \), \( (-1, 4) \), \( (0, 5) \), \( (1, 6) \), \( (2, 13) \)
---
Step 3: Graph of \( y = x + 2 \)
This is a linear function in slope-intercept form \( y = mx + b \), where the slope \( m = 1 \) and the \( y \)-intercept is \( (0, 2) \).
- \( y \)-intercept: \( (0, 2) \)
- \( x \)-intercept: \( (-2, 0) \)
- Key Points: \( (-2, 0) \), \( (0, 2) \), \( (2, 4) \)
---
Step 4: Graph of \( V = 9\pi h \)
This is a linear function representing volume \( V \) in terms of height \( h \). Since physical dimensions (volume and height) must be non-negative, we restrict the domain to \( h \ge 0 \). The graph is a ray starting at the origin with a steep positive slope of \( 9\pi \approx 28.27 \).
- Starting Point: \( (0, 0) \)
- Key Points: \( (0, 0) \), \( (1, 9\pi) \), \( (2, 18\pi) \)
---
Step 5: Graph of \( A = \pi r^2 \)
This is a quadratic function representing the area \( A \) of a circle in terms of its radius \( r \). Since the radius and area must be non-negative, the domain is restricted to \( r \ge 0 \). The graph is the right half of a parabola starting at the origin.
- Starting Point: \( (0, 0) \)
- Key Points: \( (0, 0) \), \( (1, \pi) \), \( (2, 4\pi) \), \( (3, 9\pi) \)

Snap & solve any problem in the app
Get step-by-step solutions on Sovi AI
Photo-based solutions with guided steps
Explore more problems and detailed explanations
Below are the descriptions and key plotting coordinates to construct each graph:
- \( y = x^2 + 1 \): A parabola opening upwards with its vertex at \( (0, 1) \). Plot points \( (-2, 5) \), \( (-1, 2) \), \( (0, 1) \), \( (1, 2) \), and \( (2, 5) \), then connect them with a smooth curve.
- \( y = x^3 + 5 \): An S-shaped cubic curve with an inflection point at \( (0, 5) \). Plot points \( (-2, -3) \), \( (-1, 4) \), \( (0, 5) \), \( (1, 6) \), and \( (2, 13) \), then connect them with a smooth curve.
- \( y = x + 2 \): A straight line passing through the \( y \)-intercept \( (0, 2) \) and \( x \)-intercept \( (-2, 0) \). Use a straightedge to draw a line through these points.
- \( V = 9\pi h \): A straight ray starting at the origin \( (0, 0) \) and extending into the first quadrant (since \( h \ge 0 \)) with a slope of \( 9\pi \approx 28.27 \).
- \( A = \pi r^2 \): The right half of a parabola starting at the origin \( (0, 0) \) and curving upwards into the first quadrant (since \( r \ge 0 \)). Plot points \( (0, 0) \), \( (1, \pi \approx 3.14) \), and \( (2, 4\pi \approx 12.57) \).