QUESTION IMAGE
Question
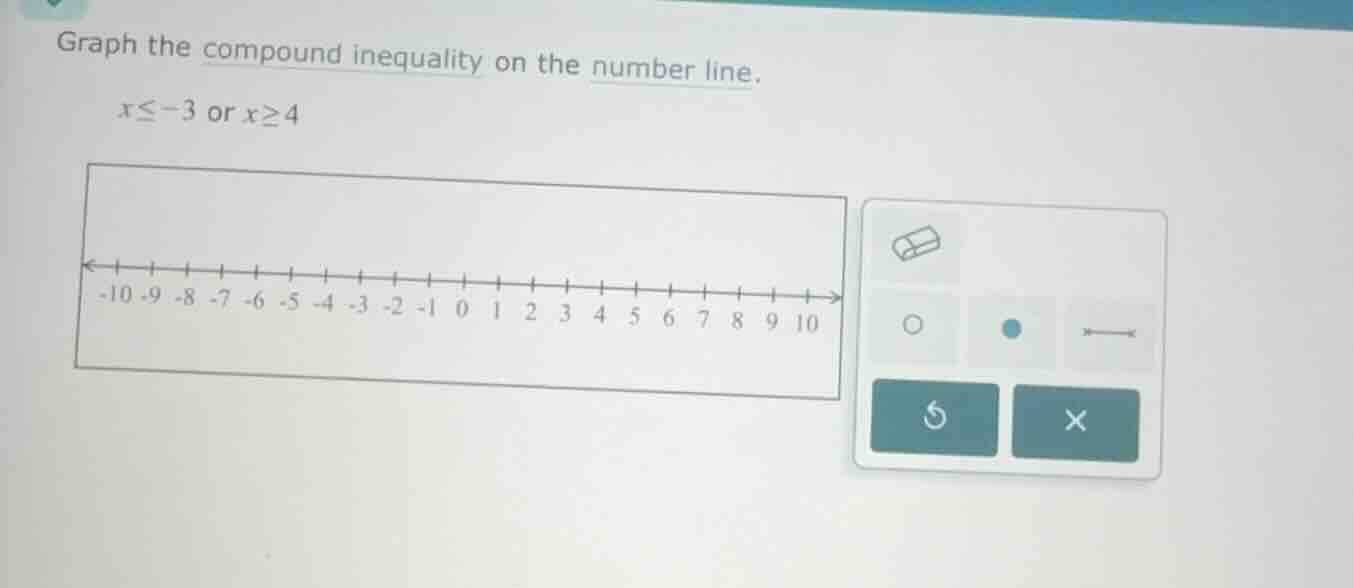
graph the compound inequality on the number line.
\\(x \le -3\\) or \\(x \ge 4\\)
<pre_analysis>
{
"quality": "clear",
"question_count": 1,
"skills_matched": [
"step_cot",
"explain_then_answer",
"quick"
],
"needs_drawing": true,
"concepts_used": [
"Compound Inequalities",
"Number Line Graphing"
],
"new_concepts": [],
"current_concepts": [
"Compound Inequalities",
"Number Line Graphing"
]
}
</pre_analysis>
<reasoning>
Analyze the compound inequality
\[
x \le -3 \quad \text{or} \quad x \ge 4
\]
Determine the boundary points and intervals
- For \(x \le -3\): A solid circle at \(-3\) with a ray pointing to the left.
- For \(x \ge 4\): A solid circle at \(4\) with a ray pointing to the right.
</reasoning>
<answer>
To graph the compound inequality \(x \le -3\) or \(x \ge 4\) on the number line:
- Place a solid circle at \(-3\) and draw a ray pointing to the left.
- Place a solid circle at \(4\) and draw a ray pointing to the right.
</answer>
<plot>
{
"elements": [
{
"type": "line",
"params": [[-11, 0], [11, 0]],
"properties": {
"strokeColor": "#583C87",
"strokeWidth": 2,
"fixed": true
}
},
{
"type": "point",
"params": [[-3, 0]],
"properties": {
"name": "-3",
"size": 4,
"color": "#8C55F2",
"fixed": true,
"withLabel": true
}
},
{
"type": "bentinequality",
"params": [{ "x": -3, "operator": "<=" }],
"properties": {
"strokeColor": "#8C55F2",
"strokeWidth": 4
}
},
{
"type": "point",
"params": [[4, 0]],
"properties": {
"name": "4",
"size": 4,
"color": "#8C55F2",
"fixed": true,
"withLabel": true
}
},
{
"type": "bentinequality",
"params": [{ "x": 4, "operator": ">=" }],
"properties": {
"strokeColor": "#8C55F2",
"strokeWidth": 4
}
}
],
"timestamps": [0.1, 0.5]
}
</plot>
<post_analysis>
{
"subject": "Mathematics",
"question_type": "Free Response",
"knowledge_point": [
"Mathematics",
"Algebra",
"Compound Inequalities"
]
}
</post_analysis>

Snap & solve any problem in the app
Get step-by-step solutions on Sovi AI
Photo-based solutions with guided steps
Explore more problems and detailed explanations
<pre_analysis>
{
"quality": "clear",
"question_count": 1,
"skills_matched": [
"step_cot",
"explain_then_answer",
"quick"
],
"needs_drawing": true,
"concepts_used": [
"Compound Inequalities",
"Number Line Graphing"
],
"new_concepts": [],
"current_concepts": [
"Compound Inequalities",
"Number Line Graphing"
]
}
</pre_analysis>
<reasoning>
Analyze the compound inequality
\[
x \le -3 \quad \text{or} \quad x \ge 4
\]
Determine the boundary points and intervals
- For \(x \le -3\): A solid circle at \(-3\) with a ray pointing to the left.
- For \(x \ge 4\): A solid circle at \(4\) with a ray pointing to the right.
</reasoning>
<answer>
To graph the compound inequality \(x \le -3\) or \(x \ge 4\) on the number line:
- Place a solid circle at \(-3\) and draw a ray pointing to the left.
- Place a solid circle at \(4\) and draw a ray pointing to the right.
</answer>
<plot>
{
"elements": [
{
"type": "line",
"params": [[-11, 0], [11, 0]],
"properties": {
"strokeColor": "#583C87",
"strokeWidth": 2,
"fixed": true
}
},
{
"type": "point",
"params": [[-3, 0]],
"properties": {
"name": "-3",
"size": 4,
"color": "#8C55F2",
"fixed": true,
"withLabel": true
}
},
{
"type": "bentinequality",
"params": [{ "x": -3, "operator": "<=" }],
"properties": {
"strokeColor": "#8C55F2",
"strokeWidth": 4
}
},
{
"type": "point",
"params": [[4, 0]],
"properties": {
"name": "4",
"size": 4,
"color": "#8C55F2",
"fixed": true,
"withLabel": true
}
},
{
"type": "bentinequality",
"params": [{ "x": 4, "operator": ">=" }],
"properties": {
"strokeColor": "#8C55F2",
"strokeWidth": 4
}
}
],
"timestamps": [0.1, 0.5]
}
</plot>
<post_analysis>
{
"subject": "Mathematics",
"question_type": "Free Response",
"knowledge_point": [
"Mathematics",
"Algebra",
"Compound Inequalities"
]
}
</post_analysis>