QUESTION IMAGE
Question
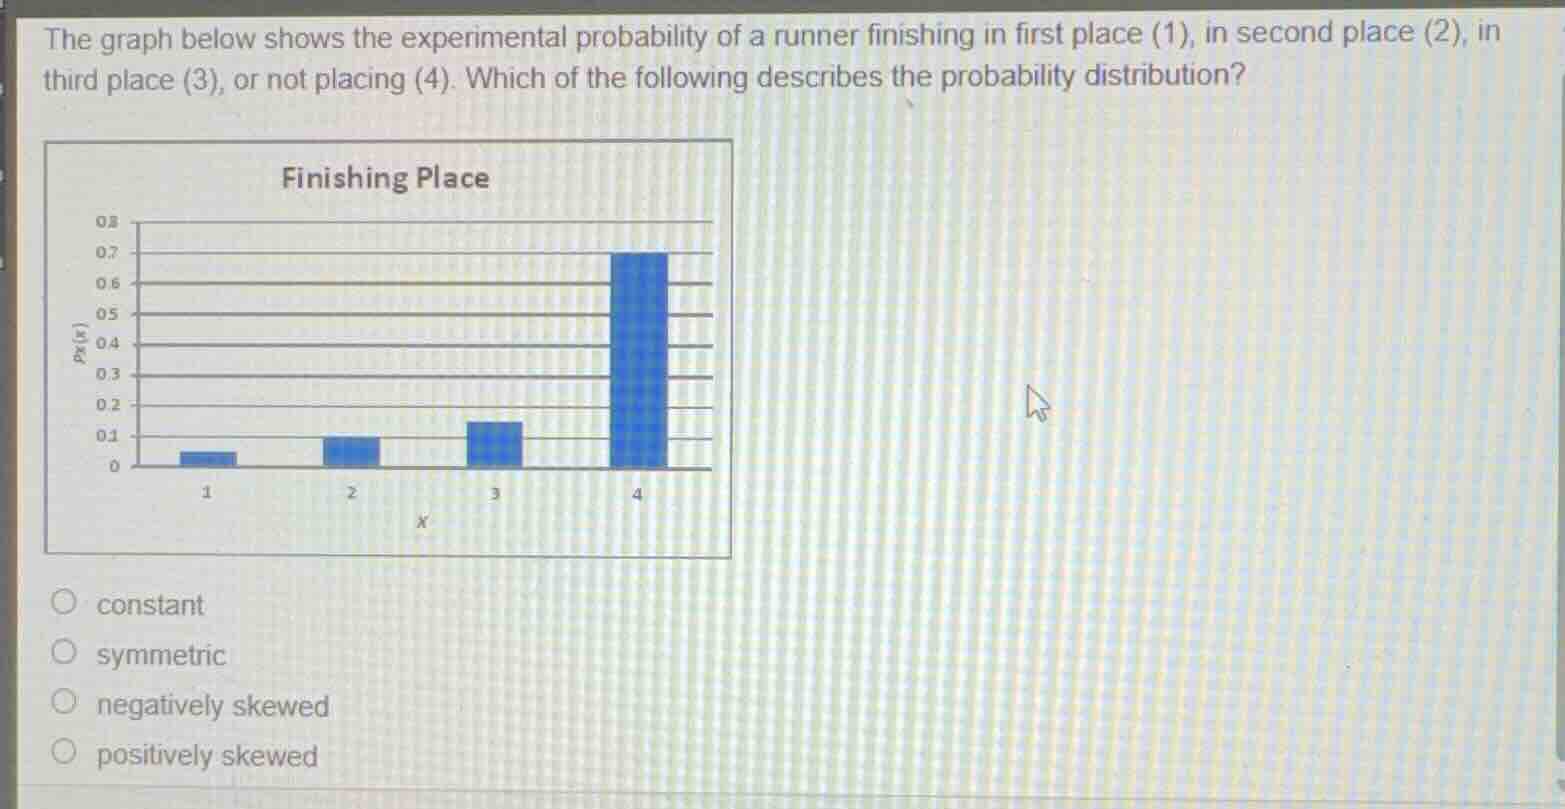
the graph below shows the experimental probability of a runner finishing in first place (1), in second place (2), in third place (3), or not placing (4). which of the following describes the probability distribution?
finishing place
constant
symmetric
negatively skewed
positively skewed
Analyze the shape of the distribution
Using the Skewed Distribution Properties knowledge point, we observe the heights of the bars across the values on the horizontal axis \(x\):
- At \(x = 1\), the probability is very low (\(0.05\)).
- At \(x = 2\), the probability is \(0.10\).
- At \(x = 3\), the probability is \(0.15\).
- At \(x = 4\), the probability is very high (\(0.70\)).
The data values are concentrated on the right side (high values), while a long tail extends to the left toward the lower values.
Determine the direction of skewness
Using the Skewed Left knowledge point:
- A distribution with a long tail on the left side is described as skewed left or negatively skewed.
- Conversely, a distribution with a long tail on the right side is described as skewed right or positively skewed.
- Since the tail of this probability distribution points toward the left (negative direction), it is negatively skewed.

Snap & solve any problem in the app
Get step-by-step solutions on Sovi AI
Photo-based solutions with guided steps
Explore more problems and detailed explanations
- constant
- symmetric
- negatively skewed (Correct answer)
- positively skewed