QUESTION IMAGE
Question
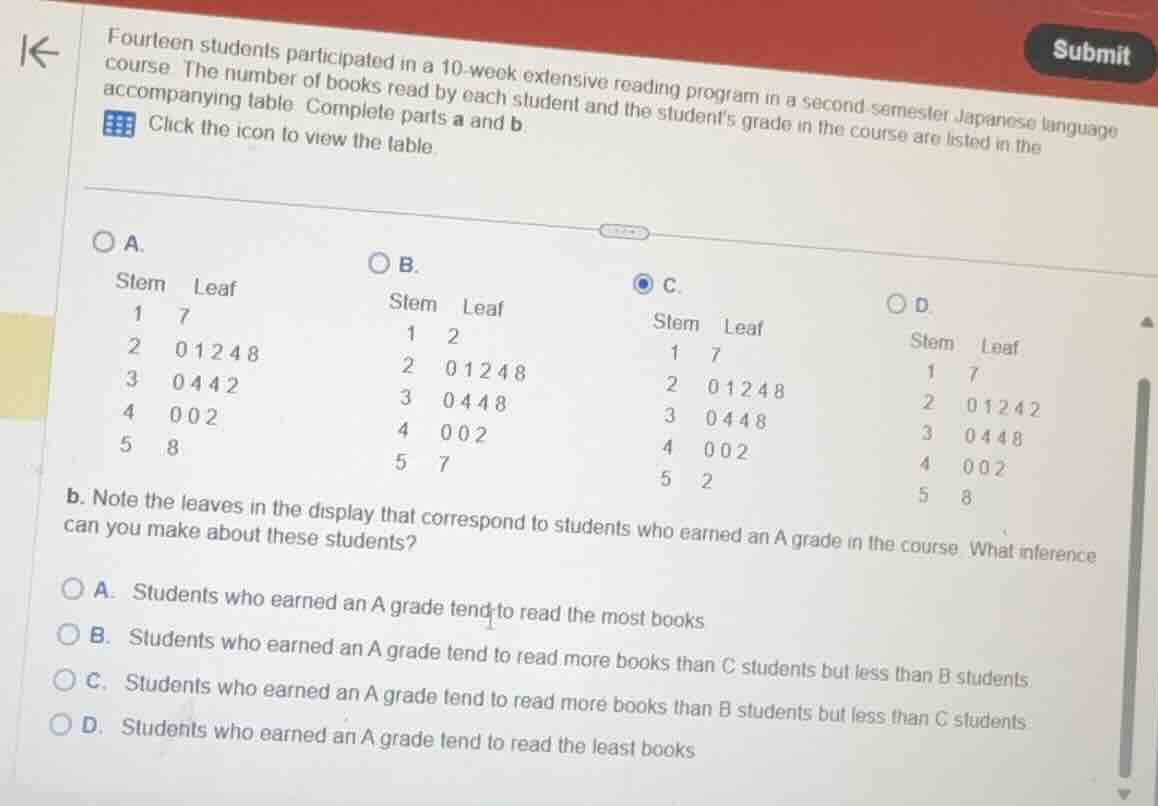
fourteen students participated in a 10-week extensive reading program in a second-semester japanese language course. the number of books read by each student and the students grade in the course are listed in the accompanying table. complete parts a and b.
click the icon to view the table.
a.
stem leaf
1 7
2 01248
3 0442
4 002
5 8
b.
stem leaf
1 2
2 01248
3 0448
4 002
5 7
c.
stem leaf
1 7
2 01248
3 0448
4 002
5 2
d.
stem leaf
1 7
2 01242
3 0448
4 002
5 8
b. note the leaves in the display that correspond to students who earned an a grade in the course. what inference can you make about these students?
a. students who earned an a grade tend to read the most books.
b. students who earned an a grade tend to read more books than c students but less than b students.
c. students who earned an a grade tend to read more books than b students but less than c students.
d. students who earned an a grade tend to read the least books.
🆕 New Concept Discovered: Stem-and-Leaf Plots
Organizing data by splitting numbers into stems and leaves
Step 1: Analyze the Stem-and-Leaf Plot Options
A stem-and-leaf plot organizes numerical data by splitting each value into a "stem" (the leading digit or digits) and a "leaf" (the final digit).
- The leaves in each row must be listed in ascending (numerical) order.
- Looking at the options:
- Option A: The leaves in row 3 are
0 4 4 2(not ordered). - Option D: The leaves in row 2 are
0 1 2 4 2(not ordered). - Option B and Option C: The leaves are properly ordered in ascending order.
Comparing the selected option C with B:
- In C, the stem
1has leaf7(representing the value 17), and the stem5has leaf2(representing the value 52). - In B, the stem
1has leaf2(representing 12), and the stem5has leaf7(representing 57).
Since option C is selected in the screenshot, the dataset contains the values:
\(17\), \(20, 21, 22, 24, 28\), \(30, 34, 34, 38\), \(40, 40, 42\), and \(52\).
Step 2: Evaluate Part b
Part b asks for an inference about students who earned an "A" grade based on the number of books they read.
In academic performance studies, higher grades (like an "A") typically correlate positively with higher levels of participation or effort (such as reading more books).
- Option A states: "Students who earned an A grade tend to read the most books."
- Option B and Option C make highly specific, unsupported comparative claims about B and C students.
- Option D states: "Students who earned an A grade tend to read the least books," which contradicts typical educational outcomes and positive correlation trends.
Therefore, the most reasonable inference is that students who earned an A grade tend to read the most books.

Snap & solve any problem in the app
Get step-by-step solutions on Sovi AI
Photo-based solutions with guided steps
Explore more problems and detailed explanations
Part a:
C (as selected in the image)
Part b:
A. Students who earned an A grade tend to read the most books