QUESTION IMAGE
Question
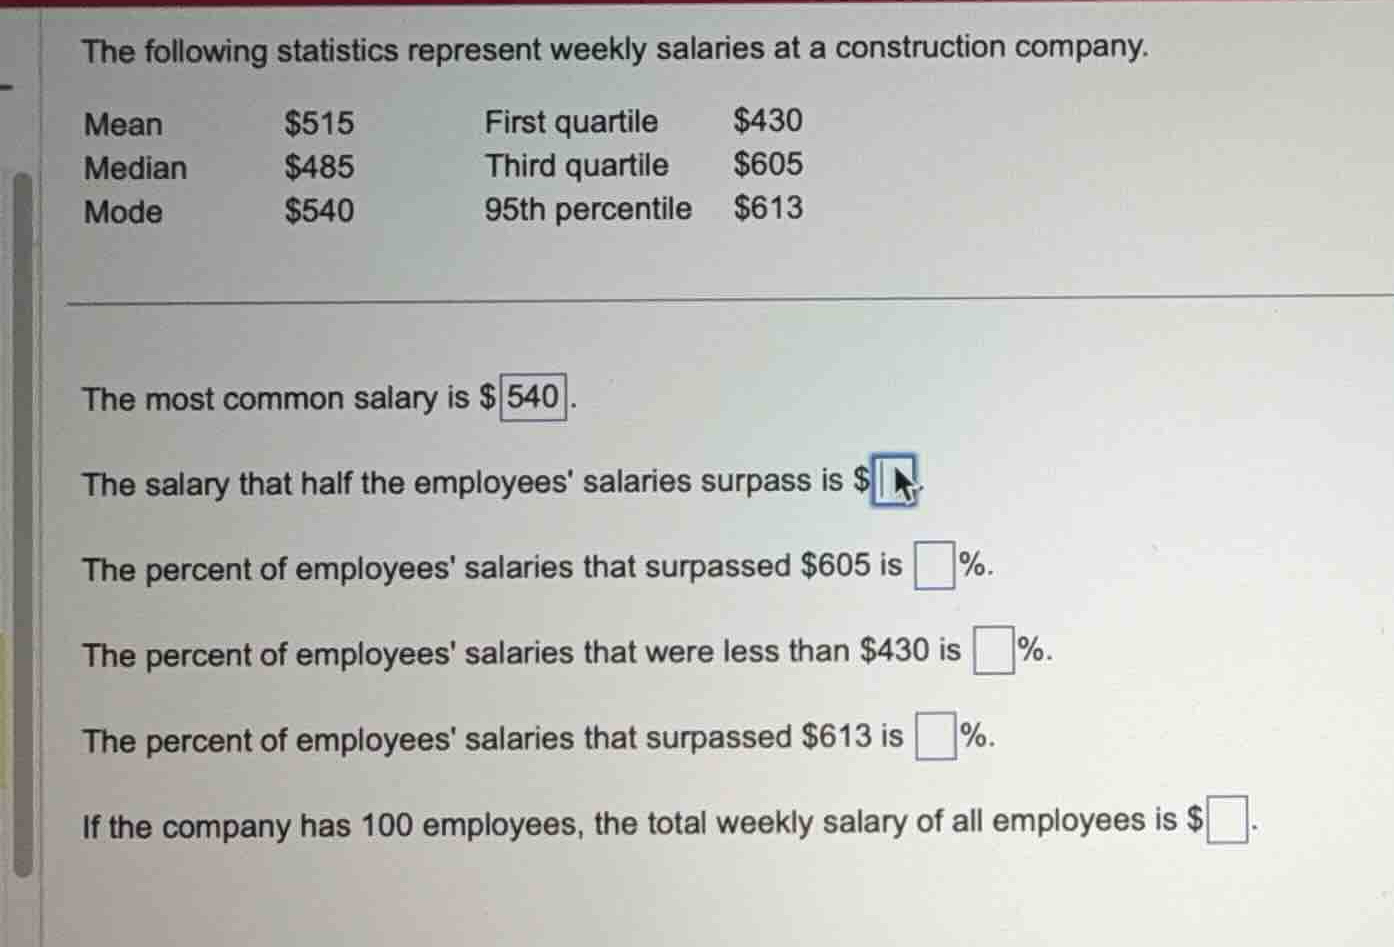
the following statistics represent weekly salaries at a construction company.
\\(\
\\)
the most common salary is \\$540.
the salary that half the employees salaries surpass is \\$\box.
the percent of employees salaries that surpassed \\$605 is \\$\box\\%.
the percent of employees salaries that were less than \\$430 is \\$\box\\%.
the percent of employees salaries that surpassed \\$613 is \\$\box\\%.
if the company has 100 employees, the total weekly salary of all employees is \\$\box.
Identify the most common salary
Using the Mode Calculation knowledge point
Determine the salary that half the employees' salaries surpass
Using the Median Calculation knowledge point
Calculate the percent of salaries surpassing \$605
Using the Third Quartile Calculation knowledge point
Calculate the percent of salaries less than \$430
Using the First Quartile Calculation knowledge point
Calculate the percent of salaries surpassing \$613
Using the Percentiles knowledge point
Calculate the total weekly salary for 100 employees
Using the Mean Calculation knowledge point

Snap & solve any problem in the app
Get step-by-step solutions on Sovi AI
Photo-based solutions with guided steps
Explore more problems and detailed explanations
| No. | Answer |
|---|---|
| 2 | \(485\) |
| 3 | \(25\) |
| 4 | \(25\) |
| 5 | \(5\) |
| 6 | \(51,500\) |