QUESTION IMAGE
Question
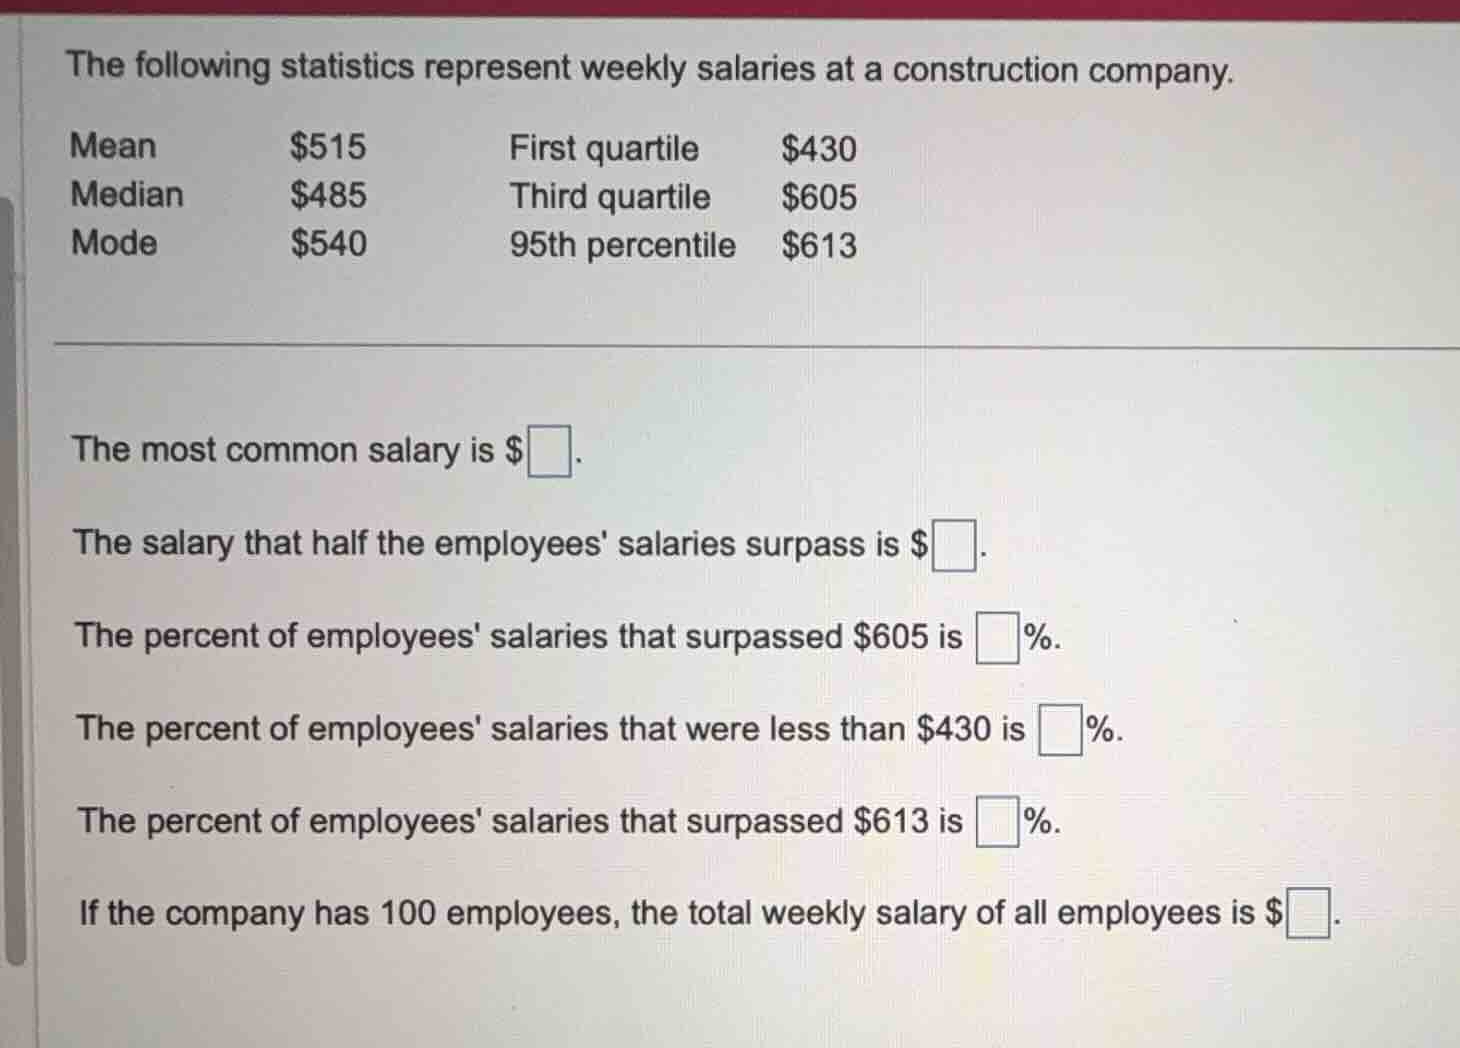
the following statistics represent weekly salaries at a construction company.
mean: $515, first quartile: $430
median: $485, third quartile: $605
mode: $540, 95th percentile: $613
the most common salary is $ .
the salary that half the employees salaries surpass is $ .
the percent of employees salaries that surpassed $605 is %.
the percent of employees salaries that were less than $430 is %.
the percent of employees salaries that surpassed $613 is %.
if the company has 100 employees, the total weekly salary of all employees is $ .
Identify the most common salary
Identify the median salary
Calculate percentages from quartiles and percentiles
Calculate the total weekly salary

Snap & solve any problem in the app
Get step-by-step solutions on Sovi AI
Photo-based solutions with guided steps
Explore more problems and detailed explanations
Question 1
The most common salary is $<blank>540</blank>.
Question 2
The salary that half the employees' salaries surpass is $<blank>485</blank>.
Question 3
The percent of employees' salaries that surpassed $605 is <blank>25</blank>%.
Question 4
The percent of employees' salaries that were less than $430 is <blank>25</blank>%.
Question 5
The percent of employees' salaries that surpassed $613 is <blank>5</blank>%.
Question 6
If the company has 100 employees, the total weekly salary of all employees is $<blank>51500</blank>.