QUESTION IMAGE
Question
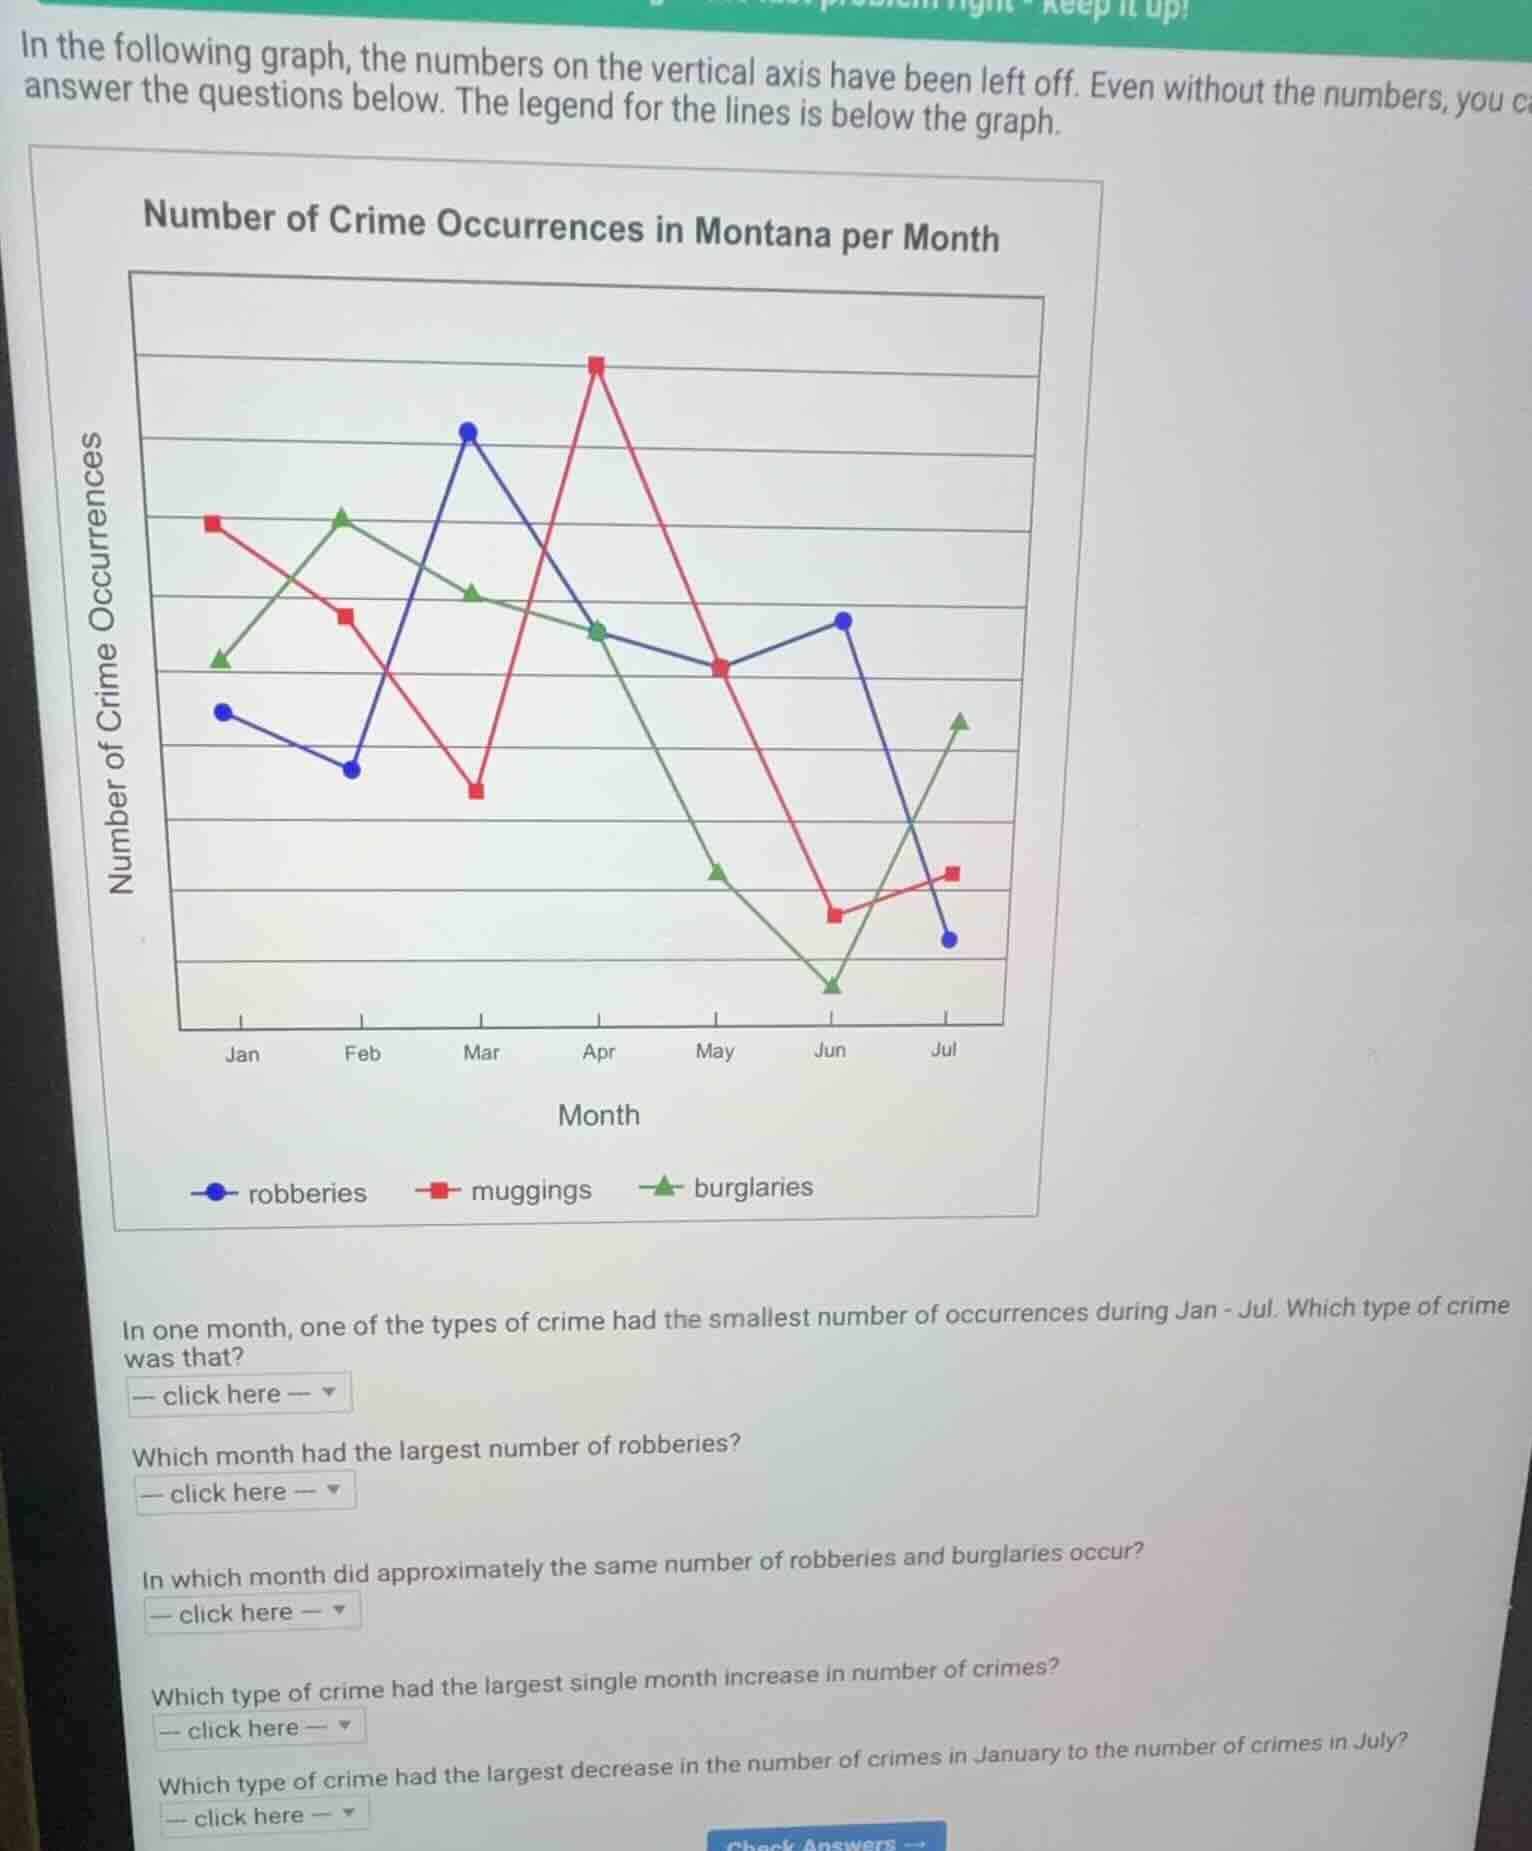
in the following graph, the numbers on the vertical axis have been left off. even without the numbers, you can answer the questions below. the legend for the lines is below the graph.
number of crime occurrences in montana per month
in one month, one of the types of crime had the smallest number of occurrences during jan - jul. which type of crime was that?
which month had the largest number of robberies?
in which month did approximately the same number of robberies and burglaries occur?
which type of crime had the largest single month increase in number of crimes?
which type of crime had the largest decrease in the number of crimes in january to the number of crimes in july?
- Identify the lowest data point across all months and crimes: burglaries in June is the lowest.
- Locate the highest point on the robberies (blue) line: this occurs in March.
- Find the month where the robberies (blue) and burglaries (green) lines intersect/align closely: this is April.
- Calculate the single-month increase for each crime: robberies had a massive jump from February to March, larger than any other single-month increase for muggings or burglaries.
- Compare the change from January to July for each crime: muggings start high in January and end much lower in July, showing the largest decrease between these two months.

Snap & solve any problem in the app
Get step-by-step solutions on Sovi AI
Photo-based solutions with guided steps
Explore more problems and detailed explanations
- burglaries
- March
- April
- robberies
- muggings