QUESTION IMAGE
Question
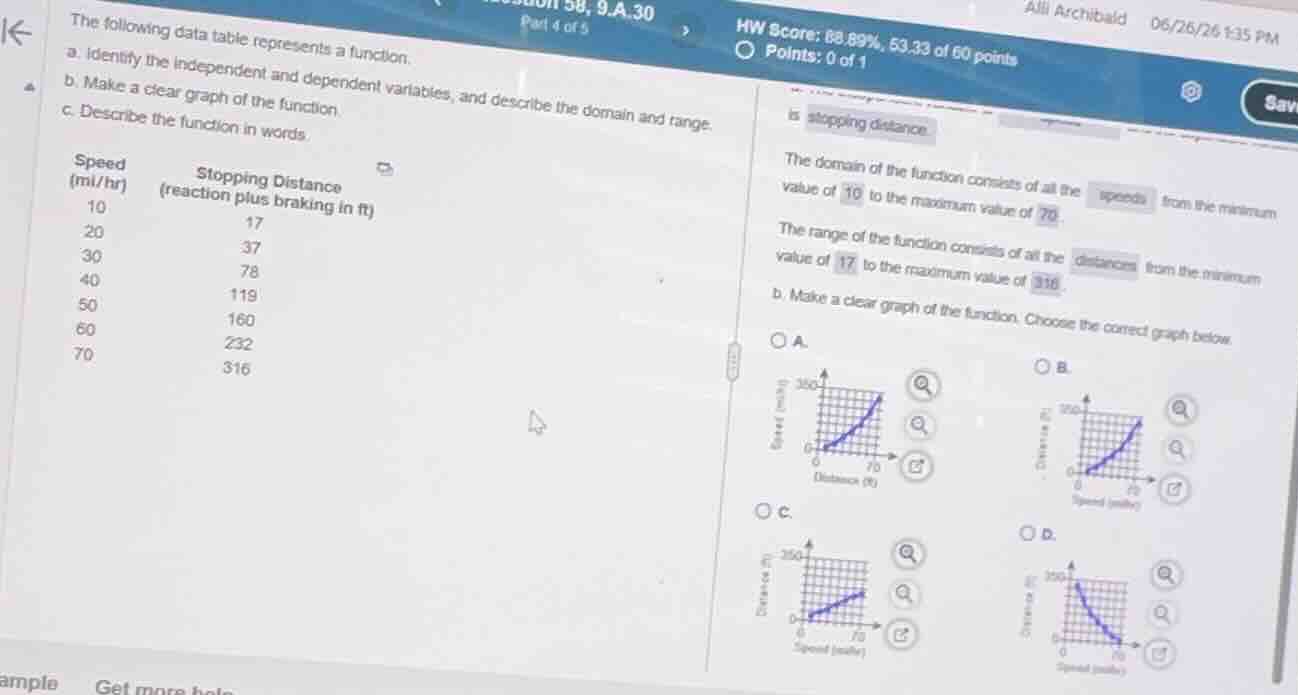
the following data table represents a function.
a. identify the independent and dependent variables, and describe the domain and range.
b. make a clear graph of the function.
c. describe the function in words.
\
$$\begin{array}{|c|c|}
\\hline
\\text{speed (mi/hr)} & \\text{stopping distance (reaction plus braking in ft)} \\\\
\\hline
10 & 17 \\\\
20 & 37 \\\\
30 & 78 \\\\
40 & 119 \\\\
50 & 160 \\\\
60 & 232 \\\\
70 & 316 \\\\
\\hline
\\end{array}$$
b. make a clear graph of the function. choose the correct graph below.
Identify variables and axes
Using the Independent and Dependent Variables knowledge point
- Independent variable: Speed (mi/hr), plotted on the horizontal axis (\(x\)-axis).
- Dependent variable: Stopping Distance (ft), plotted on the vertical axis (\(y\)-axis).
Analyze domain and range
Using the Domain and Range knowledge point
- Domain: Speed values from \(10\) to \(70\) mi/hr.
- Range: Stopping distance values from \(17\) to \(316\) ft.
Evaluate graph options
- Graph A: Has "Distance (ft)" on the horizontal axis and "Speed (mi/hr)" on the vertical axis. This is incorrect because the independent variable (Speed) must be on the horizontal axis.
- Graph B: Has "Speed (mi/hr)" on the horizontal axis and "Distance (ft)" on the vertical axis. The curve starts near \((10, 17)\) and curves upward increasingly steeply to end near \((70, 316)\). This matches the data trend where distance increases more rapidly at higher speeds (e.g., from \(10\) to \(20\) is \(+20\), but from \(60\) to \(70\) is \(+84\)).
- Graph C: Shows a linear, straight-line trend. The actual data shows a non-linear, quadratic-like growth trend, so a straight line is incorrect.
- Graph D: Shows a decreasing trend, which is incorrect because stopping distance increases as speed increases.

Snap & solve any problem in the app
Get step-by-step solutions on Sovi AI
Photo-based solutions with guided steps
Explore more problems and detailed explanations
- (A) Graph with Distance on the horizontal axis and Speed on the vertical axis
- (B) Graph with Speed on the horizontal axis and Distance on the vertical axis, showing an upward-curving non-linear trend (Correct answer)
- (C) Graph with Speed on the horizontal axis and Distance on the vertical axis, showing a straight linear trend
- (D) Graph with Speed on the horizontal axis and Distance on the vertical axis, showing a decreasing trend