QUESTION IMAGE
Question
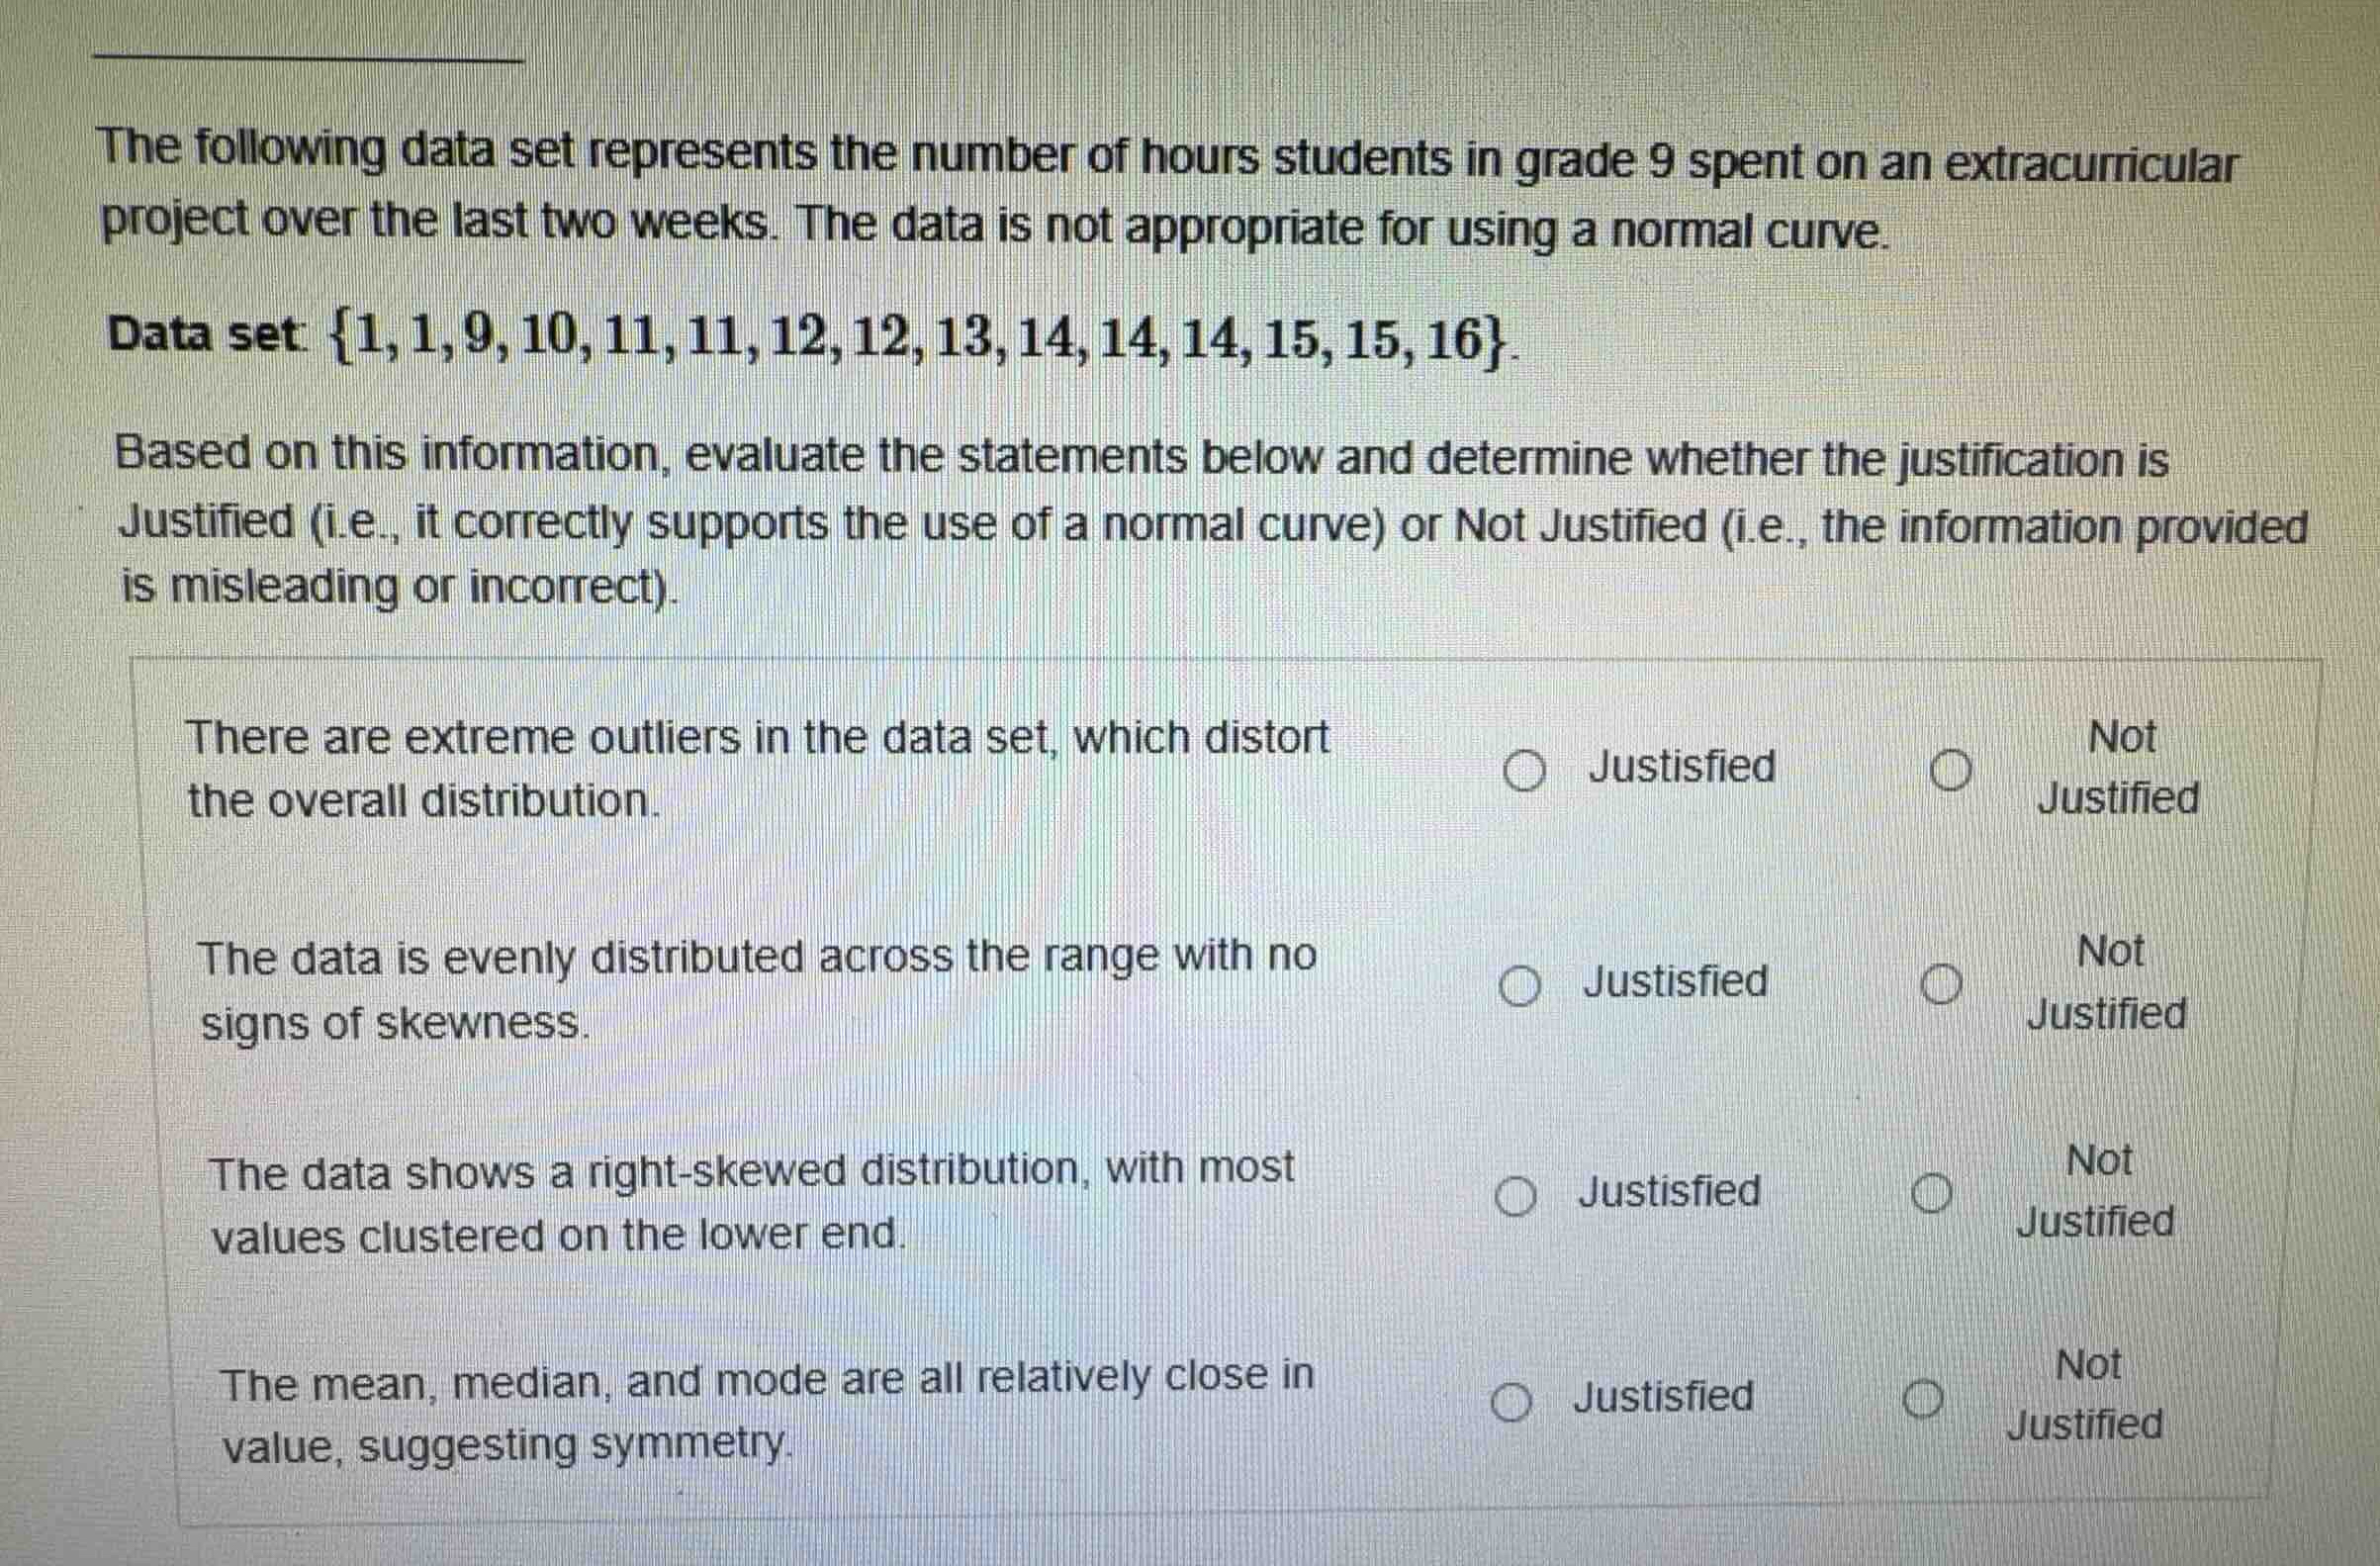
the following data set represents the number of hours students in grade 9 spent on an extracurricular project over the last two weeks. the data is not appropriate for using a normal curve.
data set: \\{1, 1, 9, 10, 11, 11, 12, 12, 13, 14, 14, 14, 15, 15, 16\\}.
based on this information, evaluate the statements below and determine whether the justification is justified (i.e., it correctly supports the use of a normal curve) or not justified (i.e., the information provided is misleading or incorrect).
- there are extreme outliers in the data set, which distort the overall distribution.
- the data is evenly distributed across the range with no signs of skewness.
- the data shows a right-skewed distribution, with most values clustered on the lower end.
- the mean, median, and mode are all relatively close in value, suggesting symmetry.
Analyze the given data set and context
The problem states that the data set is not appropriate for using a normal curve. We need to evaluate whether each statement is "Justified" (i.e., it correctly supports the use of a normal curve) or "Not Justified" (i.e., the information provided is misleading or incorrect).
The data set is:
Let's find the key statistics of this data set:
- Number of values \(n = 15\)
- Median: The 8th value is \(12\).
- Mode: The most frequent value is \(14\) (appears 3 times).
- Mean:
Evaluate Statement 1
Statement: "There are extreme outliers in the data set, which distort the overall distribution."
Using Outlier Detection:
- First quartile (\(Q_1\)): The median of the lower half \(\{1, 1, 9, 10, 11, 11, 12\}\) is \(10\).
- Third quartile (\(Q_3\)): The median of the upper half \(\{12, 13, 14, 14, 14, 15, 15, 16\}\) is \(14\).
- Interquartile Range (\(IQR\)) = \(Q_3 - Q_1 = 14 - 10 = 4\).
- Lower bound for outliers = \(Q_1 - 1.5 \times IQR = 10 - 6 = 4\).
- Upper bound for outliers = \(Q_3 + 1.5 \times IQR = 14 + 6 = 20\).
The values \(1, 1\) are below \(4\), making them outliers.
However, the prompt defines "Justified" as: "it correctly supports the use of a normal curve". Outliers distort a distribution and make it less suitable for a normal curve, meaning this statement explains why we cannot use a normal curve. But the definition of "Justified" in the prompt is: "it correctly supports the use of a normal curve". Since outliers do not support using a normal curve, this justification is "Not Justified".
Evaluate Statement 2
Statement: "The data is evenly distributed across the range with no signs of skewness."
Using Skewness:
The data is heavily left-skewed (skewed to the lower end) due to the low values \(1, 1\), while most values cluster between \(9\) and \(16\). Thus, the statement that there are "no signs of skewness" is factually incorrect. Therefore, this is "Not Justified".
Evaluate Statement 3
Statement: "The data shows a right-skewed distribution, with most values clustered on the lower end."
Using Skewness:
Most values are clustered on the higher end (\(9\) to \(16\)), with a long tail extending to the left (the values \(1, 1\)). This represents a left-skewed (negatively skewed) distribution, not a right-skewed distribution. Thus, the statement is factually incorrect and "Not Justified".
Evaluate Statement 4
Statement: "The mean, median, and mode are all relatively close in value, suggesting symmetry."
Using Symmetry Analysis and Normal Distribution Suitability:
- Mean \(\approx 10.87\)
- Median \(= 12\)
- Mode \(= 14\)
These values are not very close (especially considering the range of the main cluster is small), and the presence of the extreme outliers at \(1\) pulls the mean down significantly, showing asymmetry. Furthermore, symmetry supports the use of a normal curve, but we are told the data is not appropria…

Snap & solve any problem in the app
Get step-by-step solutions on Sovi AI
Photo-based solutions with guided steps
Explore more problems and detailed explanations
Question 1
There are extreme outliers in the data set, which distort the overall distribution.
- Justified
- Not Justified (Correct answer)
Question 2
The data is evenly distributed across the range with no signs of skewness.
- Justified
- Not Justified (Correct answer)
Question 3
The data shows a right-skewed distribution, with most values clustered on the lower end.
- Justified
- Not Justified (Correct answer)
Question 4
The mean, median, and mode are all relatively close in value, suggesting symmetry.
- Justified
- Not Justified (Correct answer)