QUESTION IMAGE
Question
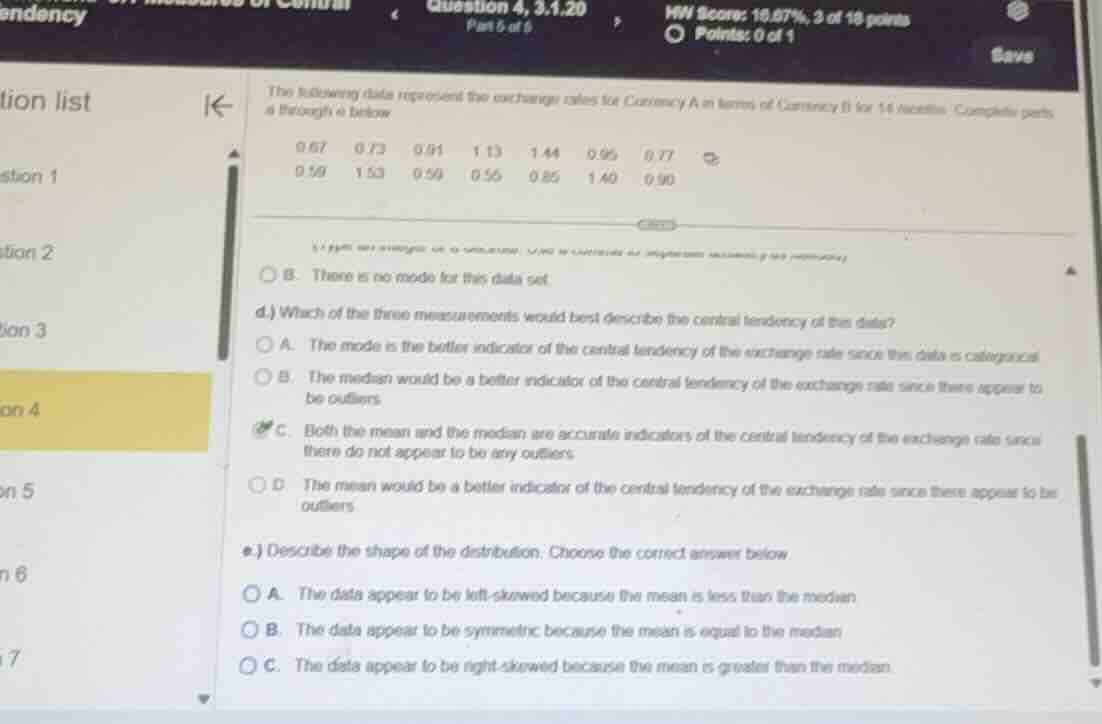
the following data represent the exchange rates for currency a in terms of currency b for 14 months. complete parts a through e below.
\\
\
\\
d.) which of the three measurements would best describe the central tendency of this data?
a. the mode is the better indicator of the central tendency of the exchange rate since this data is categorical.
b. the median would be a better indicator of the central tendency of the exchange rate since there appear to be outliers.
c. both the mean and the median are accurate indicators of the central tendency of the exchange rate since there do not appear to be any outliers.
d. the mean would be a better indicator of the central tendency of the exchange rate since there appear to be outliers.
e.) describe the shape of the distribution. choose the correct answer below.
a. the data appear to be left-skewed because the mean is less than the median.
b. the data appear to be symmetric because the mean is equal to the median.
c. the data appear to be right-skewed because the mean is greater than the median.
⚡ Using what you learned: comparing measures of center & spread
Step 1: Analyze the Data and Outliers
To determine which measure of central tendency is best, we look at the distribution of the 14 exchange rates:
Sorting the data from least to greatest:
The values range continuously from \(0.55\) to \(1.53\) without any extreme gaps or isolated values that would qualify as outliers. Because there are no outliers, both the mean and the median are reliable and accurate indicators of the central tendency.
Therefore, for part d, the correct choice is C: "Both the mean and the median are accurate indicators of the central tendency of the exchange rate since there do not appear to be any outliers."
---
Step 2: Calculate Mean and Median to Determine Shape
To answer part e, we calculate the mean and median of the dataset.
Mean (\(\mu\)):
Median (\(\tilde{x}\)):
Since there are \(14\) data points, the median is the average of the 7th and 8th values in the sorted list:
Comparison:
Since the mean (\(0.929\)) is greater than the median (\(0.875\)), the distribution is pulled to the right by the larger values. This indicates a right-skewed distribution.
Therefore, for part e, the correct choice is C: "The data appear to be right-skewed because the mean is greater than the median."

Snap & solve any problem in the app
Get step-by-step solutions on Sovi AI
Photo-based solutions with guided steps
Explore more problems and detailed explanations
d.) C. Both the mean and the median are accurate indicators of the central tendency of the exchange rate since there do not appear to be any outliers.
e.) C. The data appear to be right-skewed because the mean is greater than the median.