QUESTION IMAGE
Question
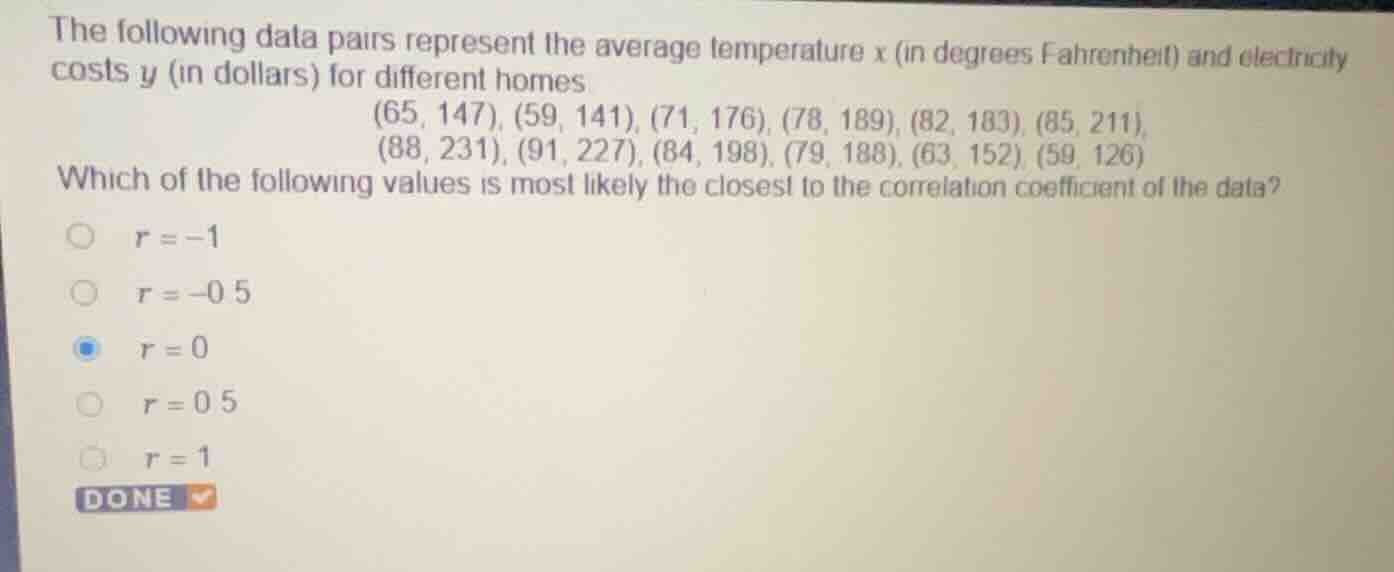
the following data pairs represent the average temperature \\(x\\) (in degrees fahrenheit) and electricity costs \\(y\\) (in dollars) for different homes:
(65, 147), (59, 141), (71, 176), (78, 189), (82, 183), (85, 211),
(88, 231), (91, 227), (84, 198), (79, 188), (63, 152), (59, 126)
which of the following values is most likely the closest to the correlation coefficient of the data?
\\(r = -1\\)
\\(r = -0.5\\)
\\(r = 0\\)
\\(r = 0.5\\)
\\(r = 1\\)
Analyze the trend of the data pairs
$$
LATEXBLOCK0
$$
Determine the direction of correlation
$$
LATEXBLOCK1
$$
Estimate the correlation coefficient
$$
LATEXBLOCK2
$$

Snap & solve any problem in the app
Get step-by-step solutions on Sovi AI
Photo-based solutions with guided steps
Explore more problems and detailed explanations
- \(r = -1\)
- \(r = -0.5\)
- \(r = 0\)
- \(r = 0.5\)
- \(r = 1\) (Correct answer)