QUESTION IMAGE
Question
follow the seven step strategy to graph the following rational function.
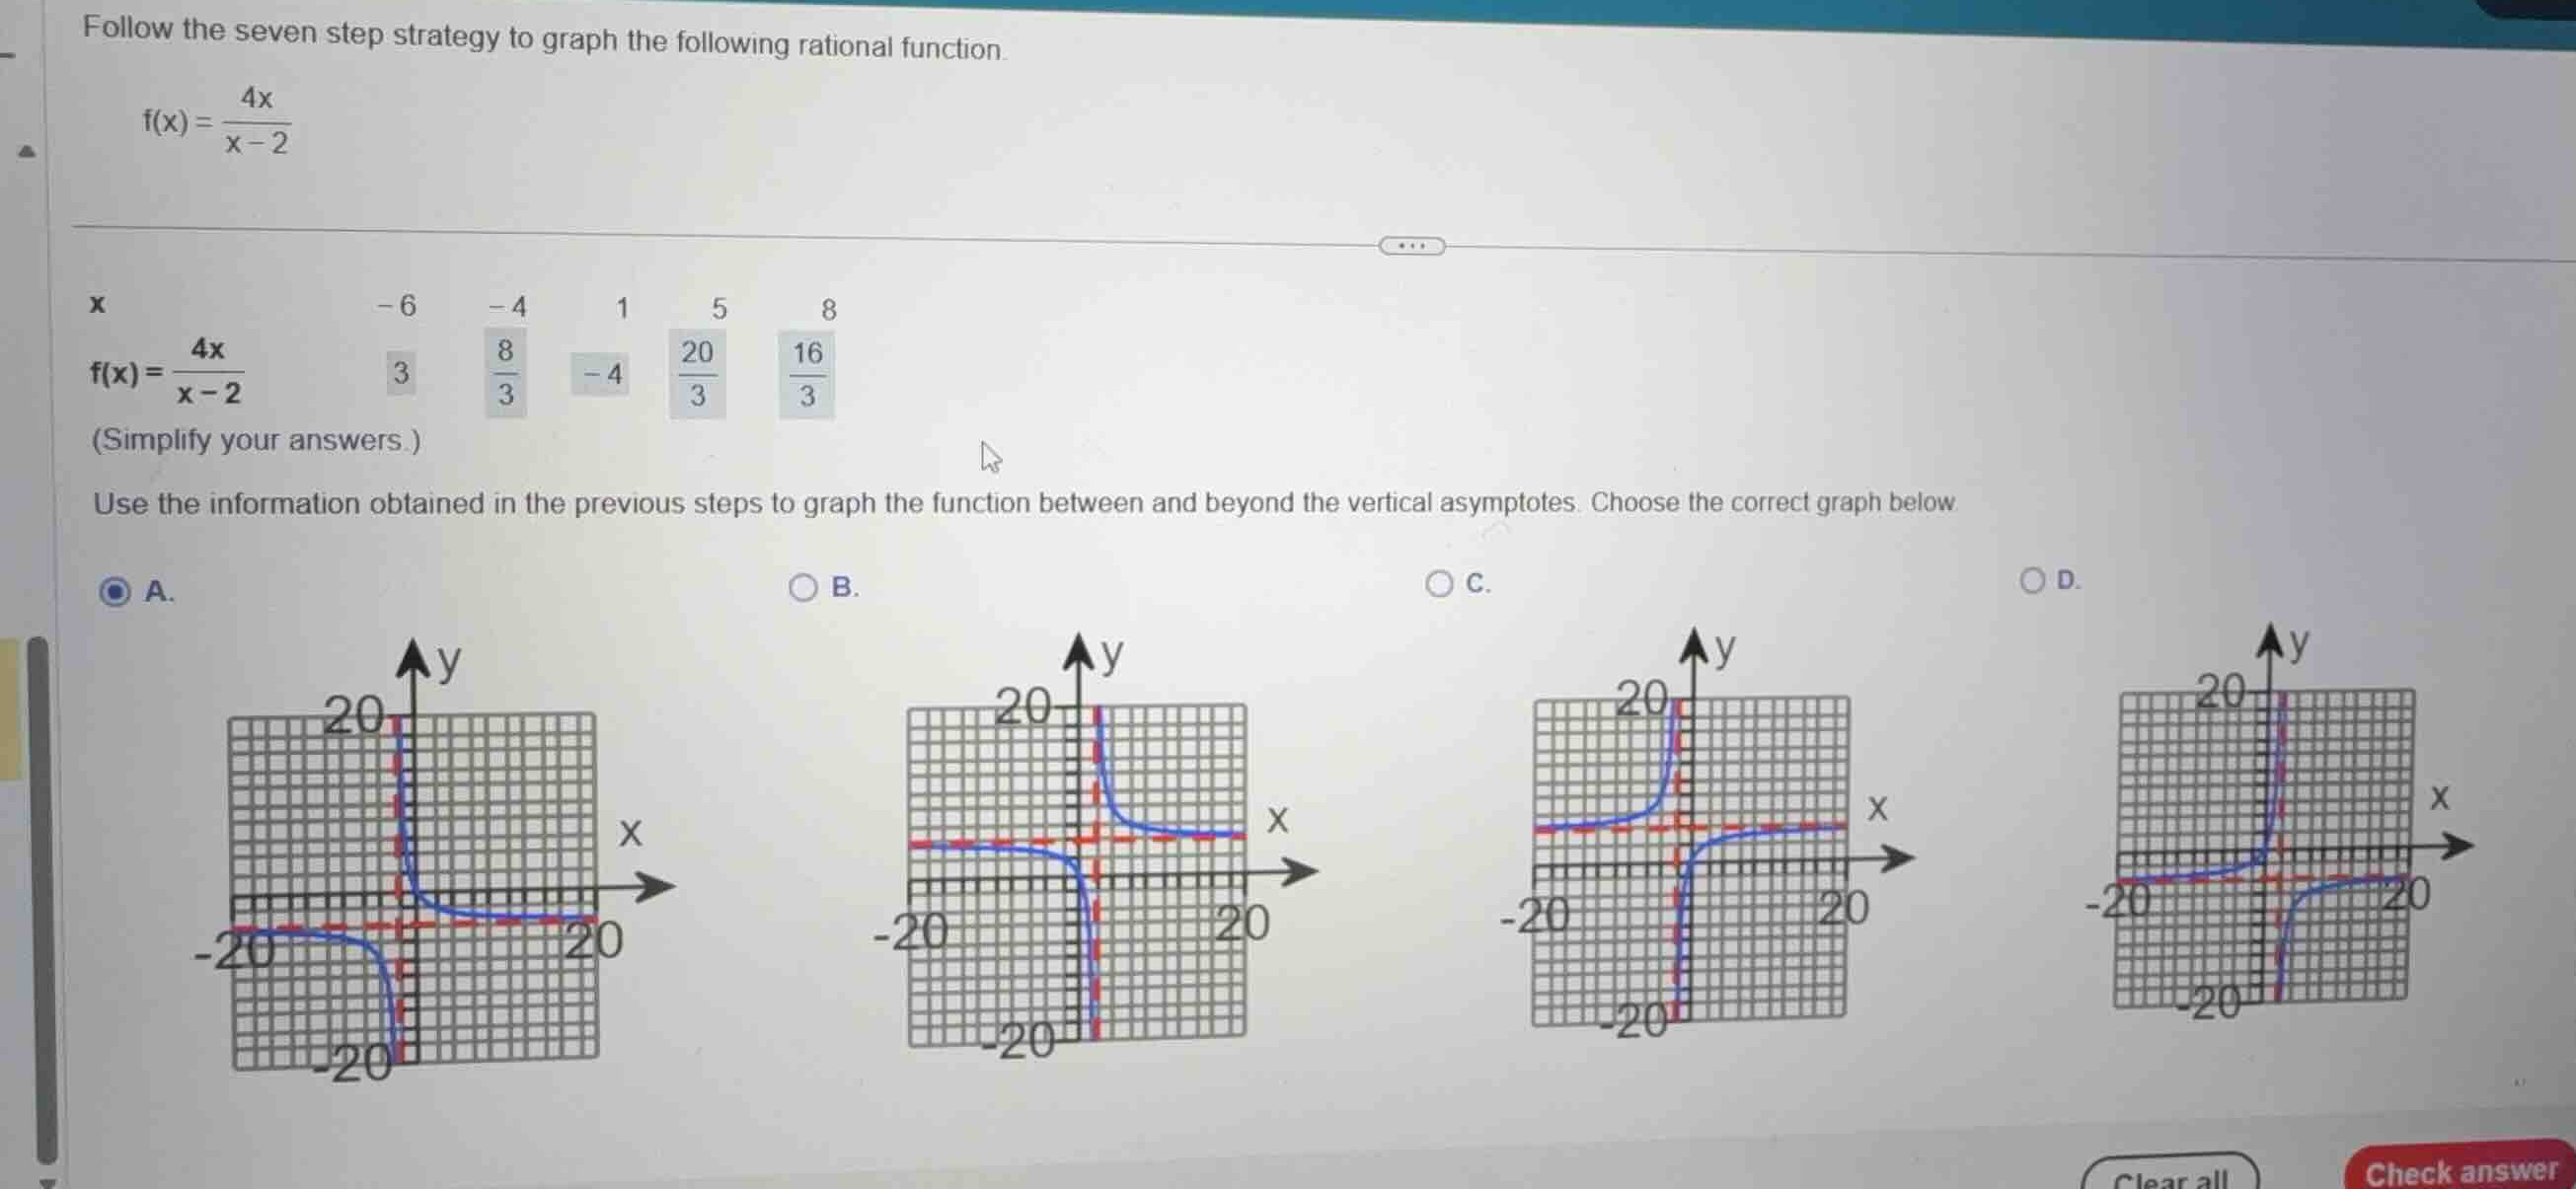
(f(x) = \frac{4x}{x - 2})
\\(\
\\)
(simplify your answers.)
use the information obtained in the previous steps to graph the function between and beyond the vertical asymptotes. choose the correct graph below.
Find the vertical asymptote
Using the Vertical Asymptotes Determination knowledge point
Find the horizontal asymptote
Using the Horizontal Asymptotes knowledge point
Evaluate key points to determine the branches
Using the Rational Function Evaluation knowledge point
Match asymptotes and points to the correct graph
The vertical asymptote is \(x = 2\) (red dashed vertical line) and the horizontal asymptote is \(y = 4\) (red dashed horizontal line).
- For \(x < 2\), the graph lies below the horizontal asymptote \(y = 4\) (since \(f(1) = -4 < 4\)).
- For \(x > 2\), the graph lies above the horizontal asymptote \(y = 4\) (since \(f(5) = 6.67 > 4\)).
Looking at the choices:
- Graph A shows the vertical asymptote at \(x = -2\) and horizontal asymptote at \(y = -4\).
- Graph B shows the vertical asymptote at \(x = 2\) and horizontal asymptote at \(y = 4\), with the left branch below \(y = 4\) and the right branch above \(y = 4\).
- Graph C shows the vertical asymptote at \(x = -2\) and horizontal asymptote at \(y = 4\).
- Graph D shows the vertical asymptote at \(x = 2\) and horizontal asymptote at \(y = -4\).
Therefore, Graph B is the correct graph.

Snap & solve any problem in the app
Get step-by-step solutions on Sovi AI
Photo-based solutions with guided steps
Explore more problems and detailed explanations
- (A) Graph with asymptotes at x = -2 and y = -4
- (B) Graph with asymptotes at x = 2 and y = 4 (Correct answer)
- (C) Graph with asymptotes at x = -2 and y = 4
- (D) Graph with asymptotes at x = 2 and y = -4