QUESTION IMAGE
Question
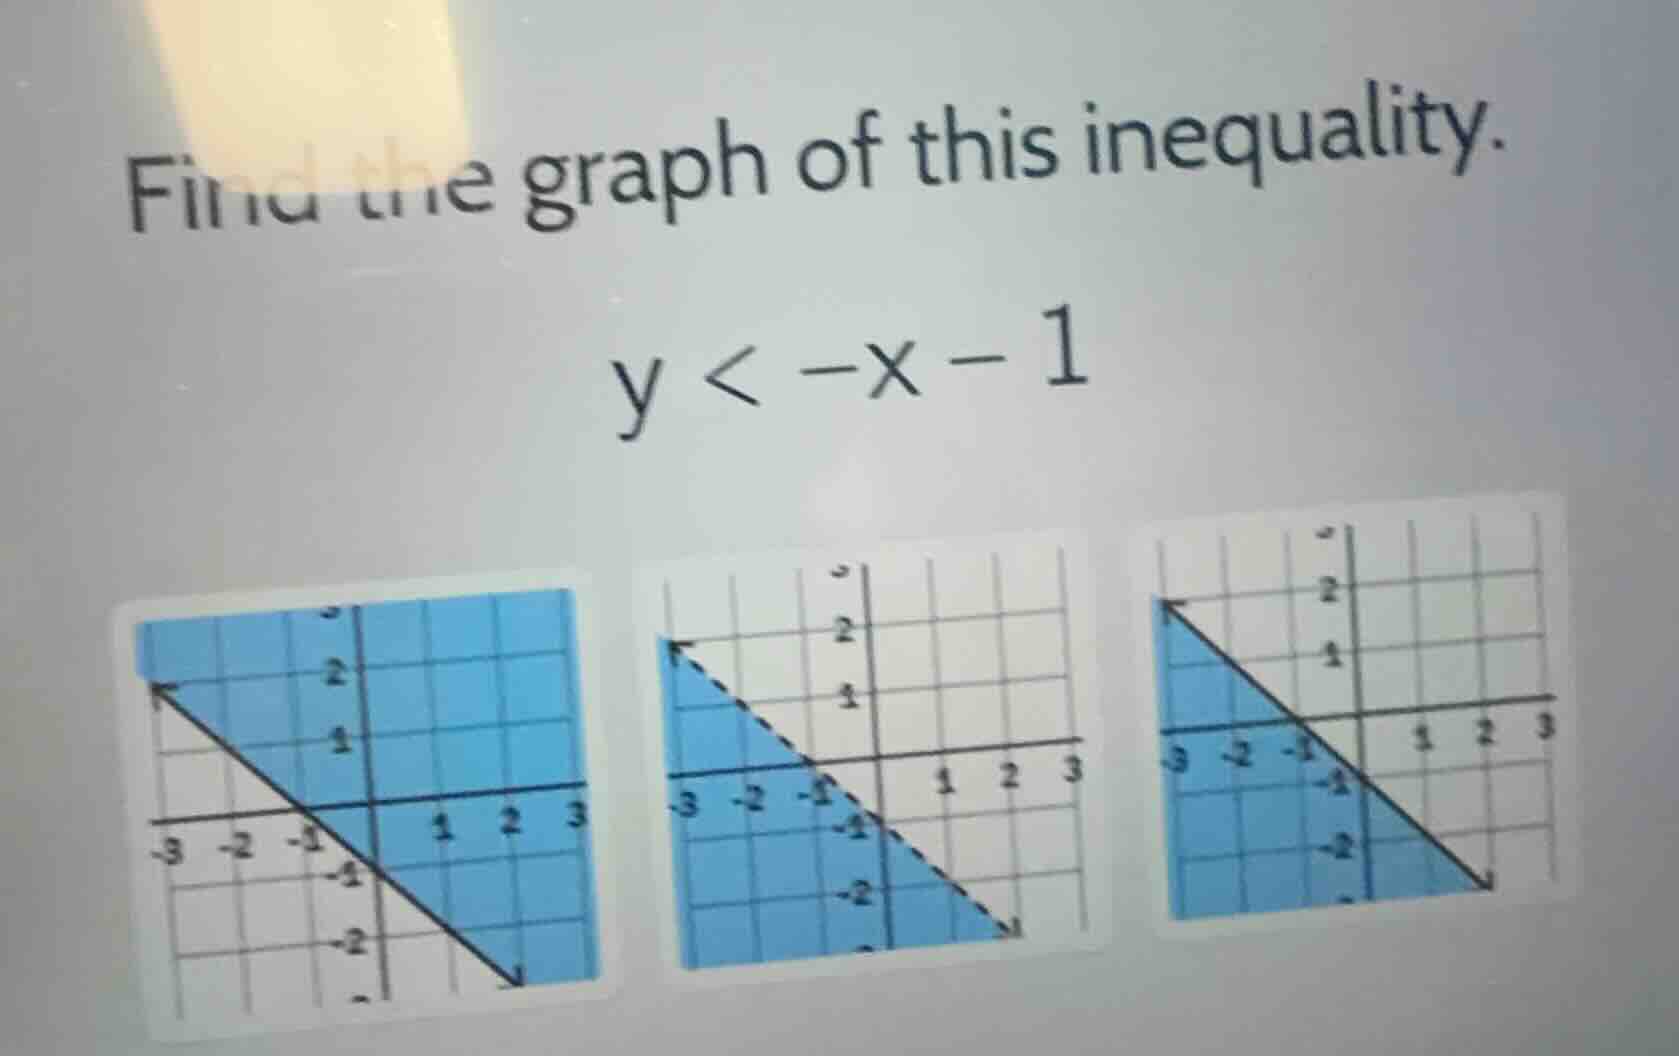
find the graph of this inequality.
\\y < -x - 1\\
<pre_analysis>
{
"quality": "clear",
"question_count": 1,
"skills_matched": [
"step_cot",
"multiple_choice_formatter",
"explain_then_answer",
"tutor",
"mastery_adaptive_brevity"
],
"needs_drawing": true,
"concepts_used": [
"Slope-Intercept Form",
"y-intercept",
"Solving Inequalities"
],
"new_concepts": [
"Graphing Linear Inequalities",
"Boundary Line Representation"
],
"current_concepts": [
"Slope-Intercept Form",
"y-intercept",
"Solving Inequalities",
"Graphing Linear Inequalities",
"Boundary Line Representation"
]
}
</pre_analysis>
<reasoning>
Identify the boundary line properties
Using the Slope-Intercept Form and y-intercept knowledge points
\[
\]
Determine the line style
Using the Solving Inequalities knowledge point
\[
\]
Determine the shaded region
Using the Solving Inequalities knowledge point
\[
\]
Match with the options
\[
\]
</reasoning>
<answer>
<mcq-option>(A) Solid line, shaded above and to the right</mcq-option>
<mcq-correct>(B) Dashed line, shaded below and to the left</mcq-correct>
<mcq-option>(C) Solid line, shaded below and to the left</mcq-option>
</answer>
<plot>
{
"elements": [
{
"type": "inequality",
"params": [
{
"js": "-x - 1",
"latex": "y < -x - 1"
},
[-2, -2]
],
"properties": {
"inverse": false,
"strict": true,
"strokeColor": "#8C55F2",
"strokeWidth": 2,
"fillColor": "rgba(140, 85, 242, 0.3)"
}
},
{
"type": "point",
"params": [[0, -1]],
"properties": {
"name": "(0, -1)",
"size": 3,
"color": "#583C87",
"withLabel": true
}
},
{
"type": "point",
"params": [[-1, 0]],
"properties": {
"name": "(-1, 0)",
"size": 3,
"color": "#583C87",
"withLabel": true
}
}
],
"timestamps": [0.5]
}
</plot>
<post_analysis>
{
"subject": "Mathematics",
"question_type": "Multiple Choice",
"knowledge_point": [
"Mathematics",
"Algebra",
"Graphing Linear Inequalities"
]
}
</post_analysis>

Snap & solve any problem in the app
Get step-by-step solutions on Sovi AI
Photo-based solutions with guided steps
Explore more problems and detailed explanations
<pre_analysis>
{
"quality": "clear",
"question_count": 1,
"skills_matched": [
"step_cot",
"multiple_choice_formatter",
"explain_then_answer",
"tutor",
"mastery_adaptive_brevity"
],
"needs_drawing": true,
"concepts_used": [
"Slope-Intercept Form",
"y-intercept",
"Solving Inequalities"
],
"new_concepts": [
"Graphing Linear Inequalities",
"Boundary Line Representation"
],
"current_concepts": [
"Slope-Intercept Form",
"y-intercept",
"Solving Inequalities",
"Graphing Linear Inequalities",
"Boundary Line Representation"
]
}
</pre_analysis>
<reasoning>
Identify the boundary line properties
Using the Slope-Intercept Form and y-intercept knowledge points
\[
\]
Determine the line style
Using the Solving Inequalities knowledge point
\[
\]
Determine the shaded region
Using the Solving Inequalities knowledge point
\[
\]
Match with the options
\[
\]
</reasoning>
<answer>
<mcq-option>(A) Solid line, shaded above and to the right</mcq-option>
<mcq-correct>(B) Dashed line, shaded below and to the left</mcq-correct>
<mcq-option>(C) Solid line, shaded below and to the left</mcq-option>
</answer>
<plot>
{
"elements": [
{
"type": "inequality",
"params": [
{
"js": "-x - 1",
"latex": "y < -x - 1"
},
[-2, -2]
],
"properties": {
"inverse": false,
"strict": true,
"strokeColor": "#8C55F2",
"strokeWidth": 2,
"fillColor": "rgba(140, 85, 242, 0.3)"
}
},
{
"type": "point",
"params": [[0, -1]],
"properties": {
"name": "(0, -1)",
"size": 3,
"color": "#583C87",
"withLabel": true
}
},
{
"type": "point",
"params": [[-1, 0]],
"properties": {
"name": "(-1, 0)",
"size": 3,
"color": "#583C87",
"withLabel": true
}
}
],
"timestamps": [0.5]
}
</plot>
<post_analysis>
{
"subject": "Mathematics",
"question_type": "Multiple Choice",
"knowledge_point": [
"Mathematics",
"Algebra",
"Graphing Linear Inequalities"
]
}
</post_analysis>