QUESTION IMAGE
Question
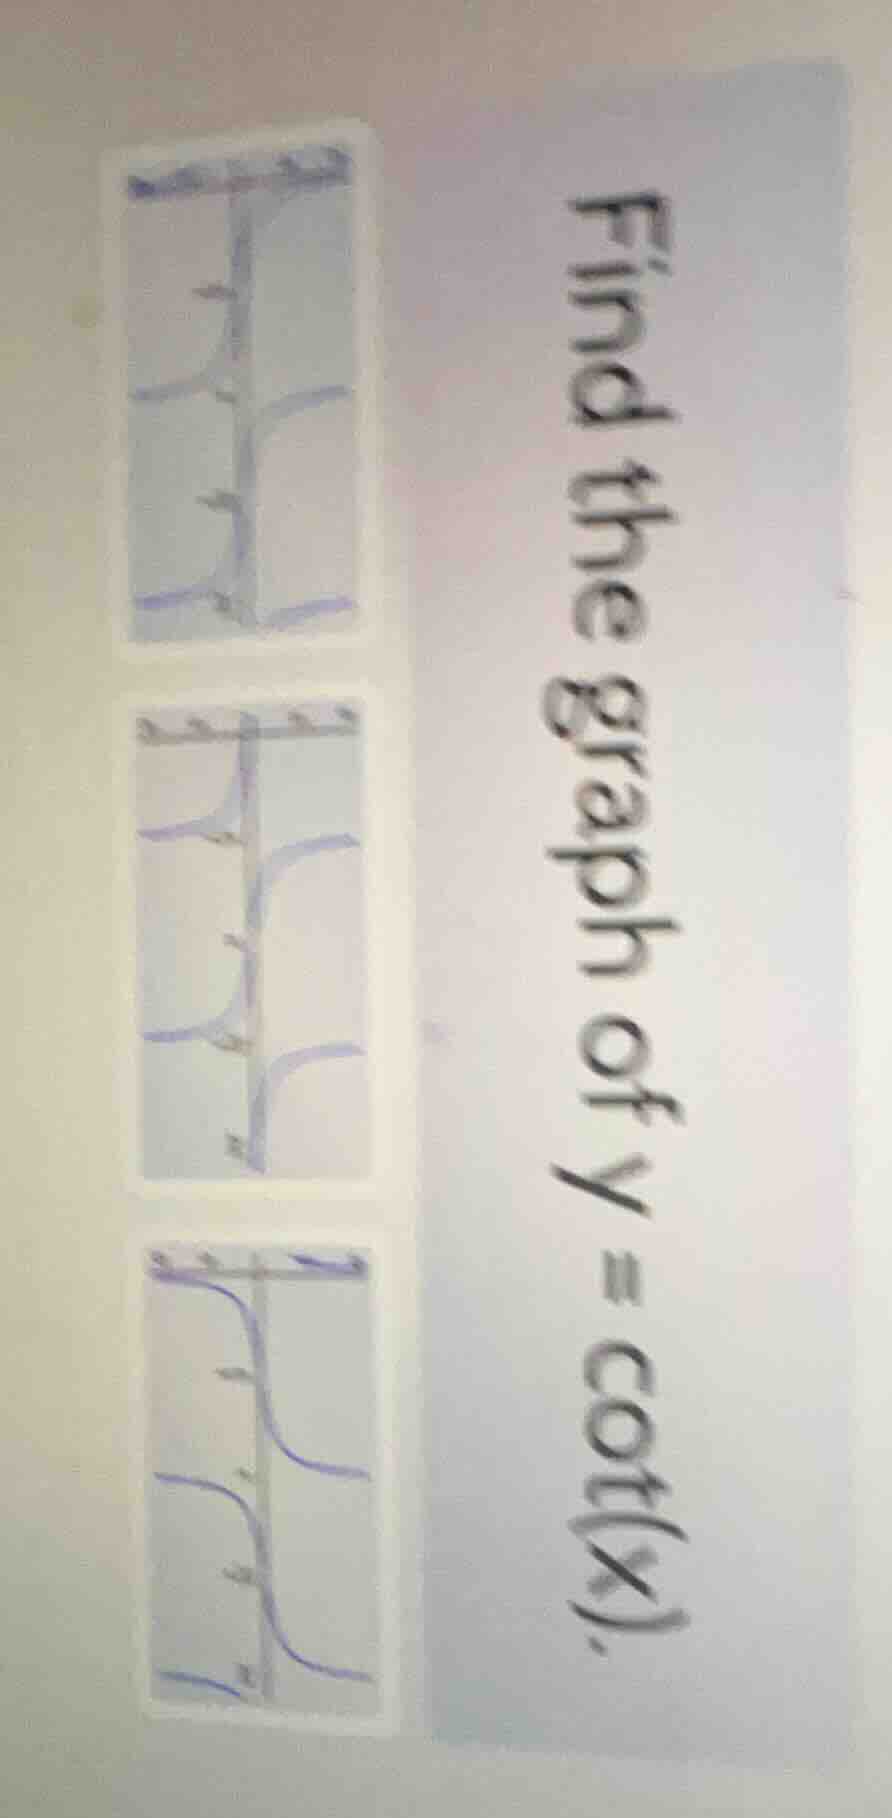
find the graph of (y = \cot(x)).
⚡ Using what you learned: Graphing Trigonometric Functions
Step 1: Identify key features of \( y = \cot(x) \)
The cotangent function is defined as:
$$ y = \cot(x) = \frac{\cos(x)}{\sin(x)} $$
- Vertical Asymptotes: Occur where \( \sin(x) = 0 \), which means at \( x = \pi n \) for any integer \( n \) (e.g., \( x = 0, \pi, -\pi \)).
- Intercepts (\(x\)-intercepts): Occur where \( \cos(x) = 0 \), which means at \( x = \frac{\pi}{2} + \pi n \) (e.g., \( x = \frac{\pi}{2}, -\frac{\pi}{2} \)).
- Behavior: Since \( \cot(x) \) is the reciprocal of \( \tan(x) \), it decreases on each interval between its asymptotes (sloping downwards from left to right).
Step 2: Compare with the given options
Let's analyze the three vertical graphs (oriented sideways in the image):
- Top Graph: Shows curves that increase from left to right. This represents the tangent function, \( y = \tan(x) \).
- Middle Graph: Shows curves that decrease from left to right, with a vertical asymptote at the vertical axis (\( x = 0 \)) and crossing the horizontal axis at half-intervals. This matches \( y = \cot(x) \).
- Bottom Graph: Shows curves shifted horizontally, where the vertical axis (\( x = 0 \)) is not an asymptote but rather an intercept or a shifted point.
Therefore, the middle graph correctly represents \( y = \cot(x) \).

Snap & solve any problem in the app
Get step-by-step solutions on Sovi AI
Photo-based solutions with guided steps
Explore more problems and detailed explanations
The correct graph is the middle option.