QUESTION IMAGE
Question
early in a presidential primary, a survey was conducted in which a random sample of 40 voters was asked which candidate, a through e, they would likely support for the nomination for president. the results are provided in the accompanying table. the letter n indicates that the voter had no opinion. complete parts (a) through (d) below.
click the icon to view the results of the survey.
(type integers or decimals rounded to three decimal places as needed.)
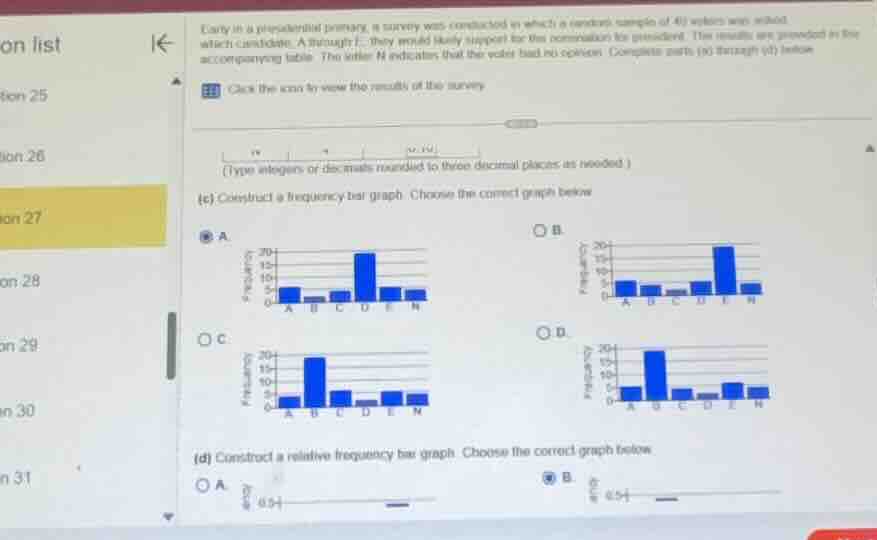
(c) construct a frequency bar graph. choose the correct graph below.
(d) construct a relative frequency bar graph. choose the correct graph below.
⚡ Using what you learned: displaying data: bar graphs & circle graphs
Step 1: Identify the correct frequency distribution
Based on the selected option A in part (c), we can determine the frequency of each category by reading the heights of the bars in the correct graph:
- A: \(6\)
- B: \(2\)
- C: \(4\)
- D: \(19\)
- E: \(5\)
- N: \(4\)
Let's verify the total sample size \(n\):
This matches the sample size of \(40\) voters mentioned in the problem description.
Step 2: Match the frequencies to the correct graph options
Let's analyze the bar heights for each option in part (c) to confirm why A is correct:
- Graph A:
- Bar A is slightly above \(5\) (value is \(6\)).
- Bar B is very low (value is \(2\)).
- Bar C is just below \(5\) (value is \(4\)).
- Bar D is just below \(20\) (value is \(19\)).
- Bar E is at \(5\) (value is \(5\)).
- Bar N is just below \(5\) (value is \(4\)).
This perfectly matches our frequency distribution.
- Graph B: Bar D is at \(20\), which is incorrect.
- Graph C: Bar B is the highest bar, which is incorrect.
- Graph D: Bar B is the highest bar, which is incorrect.
Therefore, A is the correct frequency bar graph.

Snap & solve any problem in the app
Get step-by-step solutions on Sovi AI
Photo-based solutions with guided steps
Explore more problems and detailed explanations
The correct graph for part (c) is A.