QUESTION IMAGE
Question
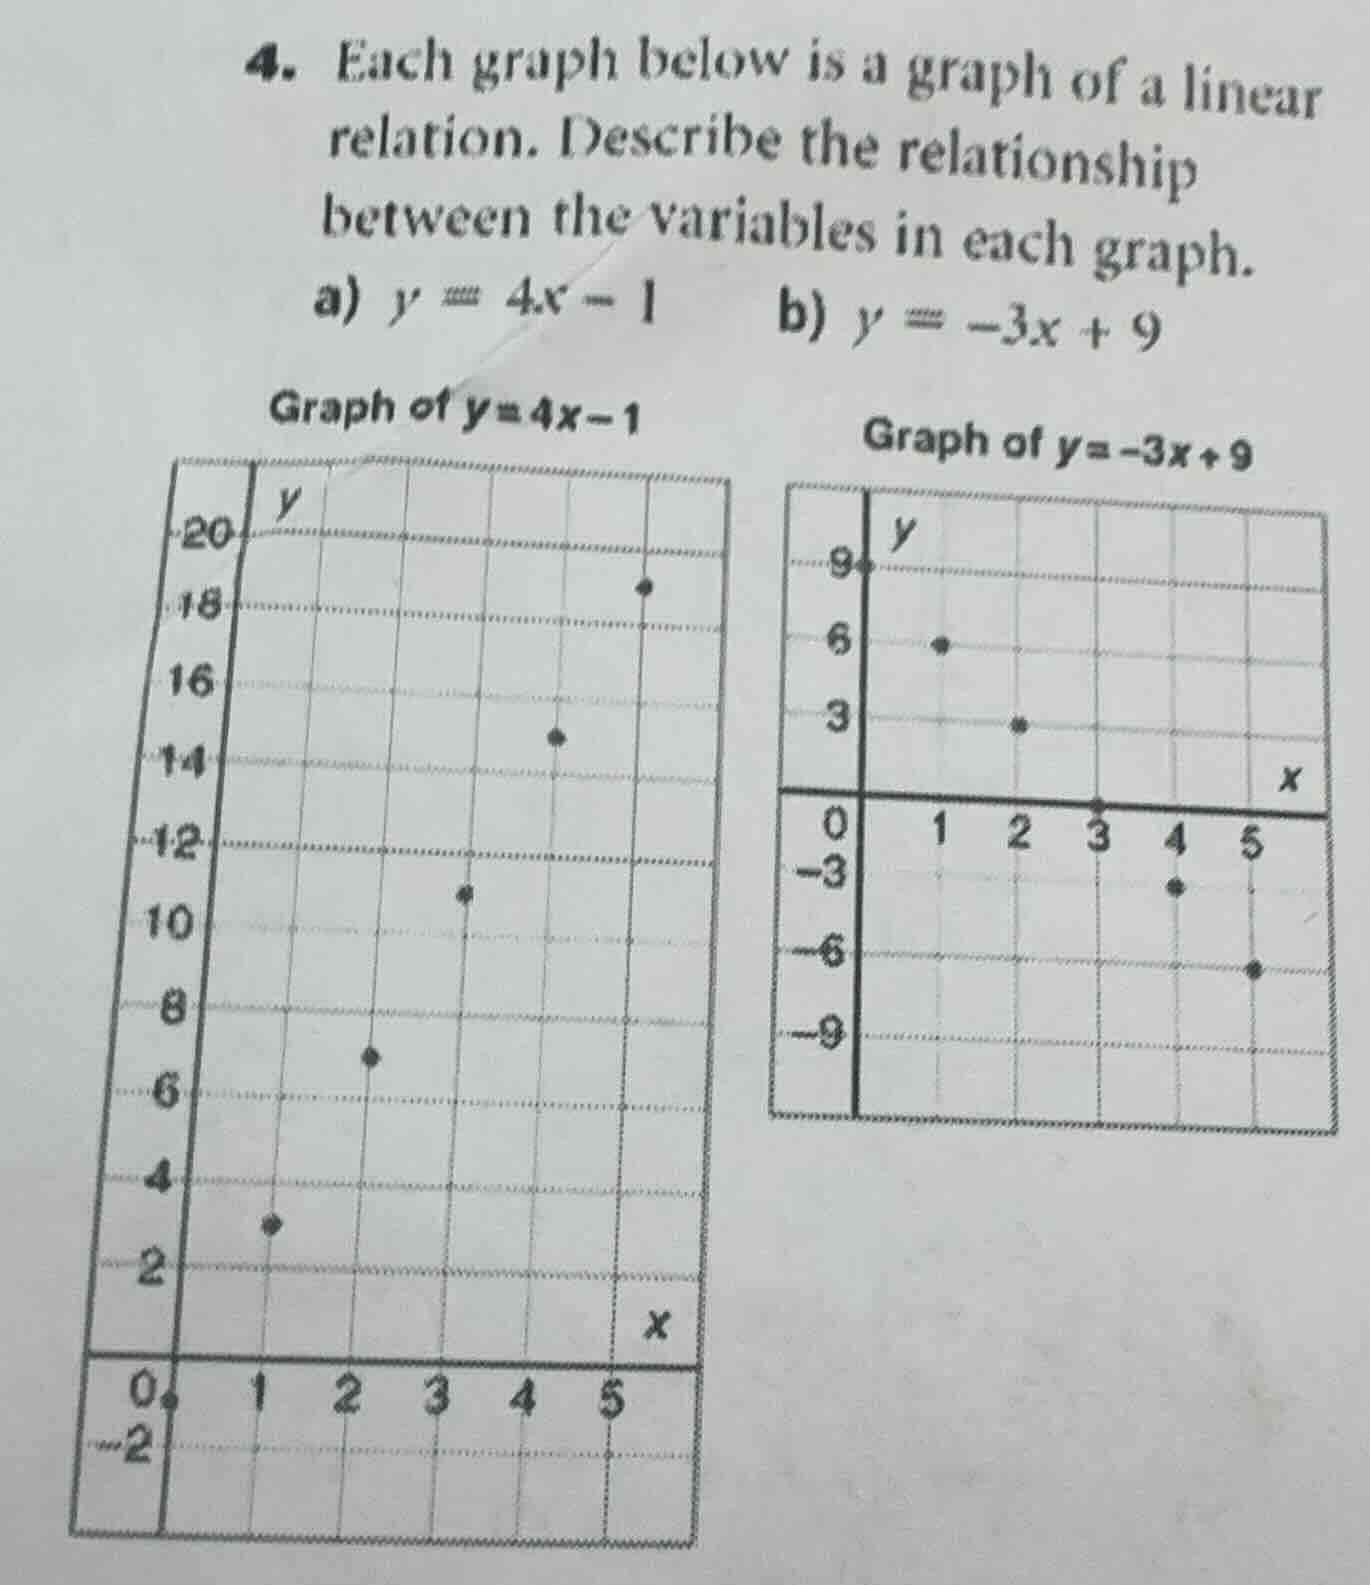
- each graph below is a graph of a linear relation. describe the relationship between the variables in each graph.
a) $y = 4x - 1$
b) $y = -3x + 9$
graph of $y = 4x - 1$
graph of $y = 4x - 1$ with x-axis from 0 to 5 and y-axis from -2 to 20, showing plotted points
graph of $y = -3x + 9$
graph of $y = -3x + 9$ with x-axis from 0 to 5 and y-axis from -9 to 9, showing plotted points
Part (a)
Step1: Analyze the slope
The equation is \( y = 4x - 1 \). The slope (\( m \)) of a linear equation \( y = mx + b \) is 4, which is positive.
Step2: Describe the relationship
A positive slope means that as the value of \( x \) (the independent variable) increases, the value of \( y \) (the dependent variable) also increases. Specifically, for every 1 - unit increase in \( x \), \( y \) increases by 4 units (because the slope is 4), and when \( x = 0 \), \( y=- 1\) (the y - intercept).
Part (b)
Step1: Analyze the slope
The equation is \( y=-3x + 9 \). The slope (\( m \)) of this linear equation is - 3, which is negative.
Step2: Describe the relationship
A negative slope means that as the value of \( x \) (the independent variable) increases, the value of \( y \) (the dependent variable) decreases. Specifically, for every 1 - unit increase in \( x \), \( y \) decreases by 3 units (because the slope is - 3), and when \( x = 0 \), \( y = 9\) (the y - intercept).

Snap & solve any problem in the app
Get step-by-step solutions on Sovi AI
Photo-based solutions with guided steps
Explore more problems and detailed explanations
s:
a) In the linear relation \( y = 4x-1 \), \( y \) increases linearly with \( x \); for each increase of 1 in \( x \), \( y \) increases by 4, and when \( x = 0 \), \( y=-1 \).
b) In the linear relation \( y=-3x + 9 \), \( y \) decreases linearly with \( x \); for each increase of 1 in \( x \), \( y \) decreases by 3, and when \( x = 0 \), \( y = 9 \).