QUESTION IMAGE
Question
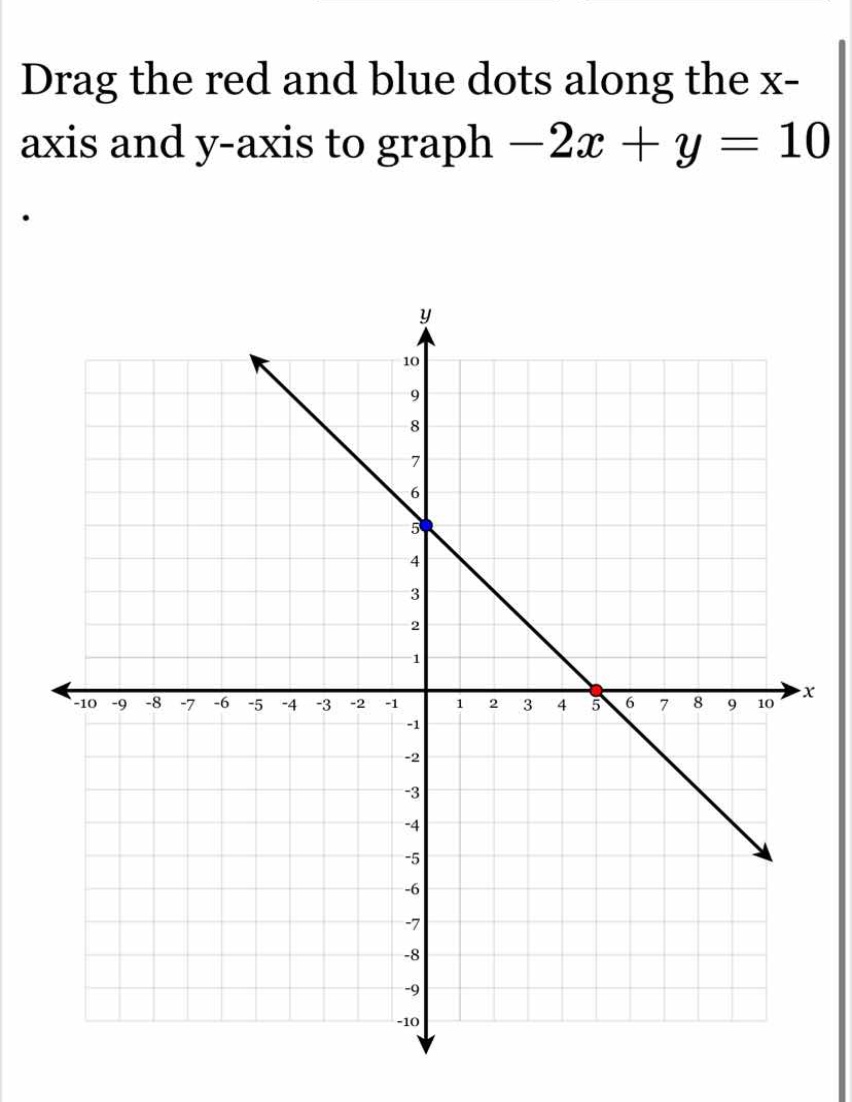
drag the red and blue dots along the x-axis and y-axis to graph \\(-2x + y = 10\\)
<pre_analysis>
{
"quality": "clear",
"question_count": 1,
"skills_matched": [
"step_cot",
"explain_then_answer",
"quick"
],
"needs_drawing": true,
"concepts_used": [
"x-intercept",
"y-intercept",
"Graphing Linear Equations"
],
"new_concepts": [],
"current_concepts": [
"x-intercept",
"y-intercept",
"Graphing Linear Equations"
]
}
</pre_analysis>
<reasoning>
Find the x-intercept
\[
\]
Find the y-intercept
\[
\]
Identify the coordinates for the dots
\[
\]
</reasoning>
<answer>
- Red dot (on the x-axis): Move to \((-5, 0)\)
- Blue dot (on the y-axis): Move to \((0, 10)\)
</answer>
<plot>
{
"elements": [
{
"type": "point",
"params": [[-5, 0]],
"properties": {
"name": "Red Dot",
"size": 4,
"color": "#F2557F",
"withLabel": true
}
},
{
"type": "point",
"params": [[0, 10]],
"properties": {
"name": "Blue Dot",
"size": 4,
"color": "#5583F2",
"withLabel": true
}
},
{
"type": "line",
"params": [[-5, 0], [0, 10]],
"properties": {
"strokeColor": "#8C55F2",
"strokeWidth": 2
}
}
]
}
</plot>
<post_analysis>
{
"subject": "Mathematics",
"question_type": "Free Response",
"knowledge_point": [
"Mathematics",
"Algebra",
"Graphing Linear Equations"
]
}
</post_analysis>

Snap & solve any problem in the app
Get step-by-step solutions on Sovi AI
Photo-based solutions with guided steps
Explore more problems and detailed explanations
<pre_analysis>
{
"quality": "clear",
"question_count": 1,
"skills_matched": [
"step_cot",
"explain_then_answer",
"quick"
],
"needs_drawing": true,
"concepts_used": [
"x-intercept",
"y-intercept",
"Graphing Linear Equations"
],
"new_concepts": [],
"current_concepts": [
"x-intercept",
"y-intercept",
"Graphing Linear Equations"
]
}
</pre_analysis>
<reasoning>
Find the x-intercept
\[
\]
Find the y-intercept
\[
\]
Identify the coordinates for the dots
\[
\]
</reasoning>
<answer>
- Red dot (on the x-axis): Move to \((-5, 0)\)
- Blue dot (on the y-axis): Move to \((0, 10)\)
</answer>
<plot>
{
"elements": [
{
"type": "point",
"params": [[-5, 0]],
"properties": {
"name": "Red Dot",
"size": 4,
"color": "#F2557F",
"withLabel": true
}
},
{
"type": "point",
"params": [[0, 10]],
"properties": {
"name": "Blue Dot",
"size": 4,
"color": "#5583F2",
"withLabel": true
}
},
{
"type": "line",
"params": [[-5, 0], [0, 10]],
"properties": {
"strokeColor": "#8C55F2",
"strokeWidth": 2
}
}
]
}
</plot>
<post_analysis>
{
"subject": "Mathematics",
"question_type": "Free Response",
"knowledge_point": [
"Mathematics",
"Algebra",
"Graphing Linear Equations"
]
}
</post_analysis>