QUESTION IMAGE
Question
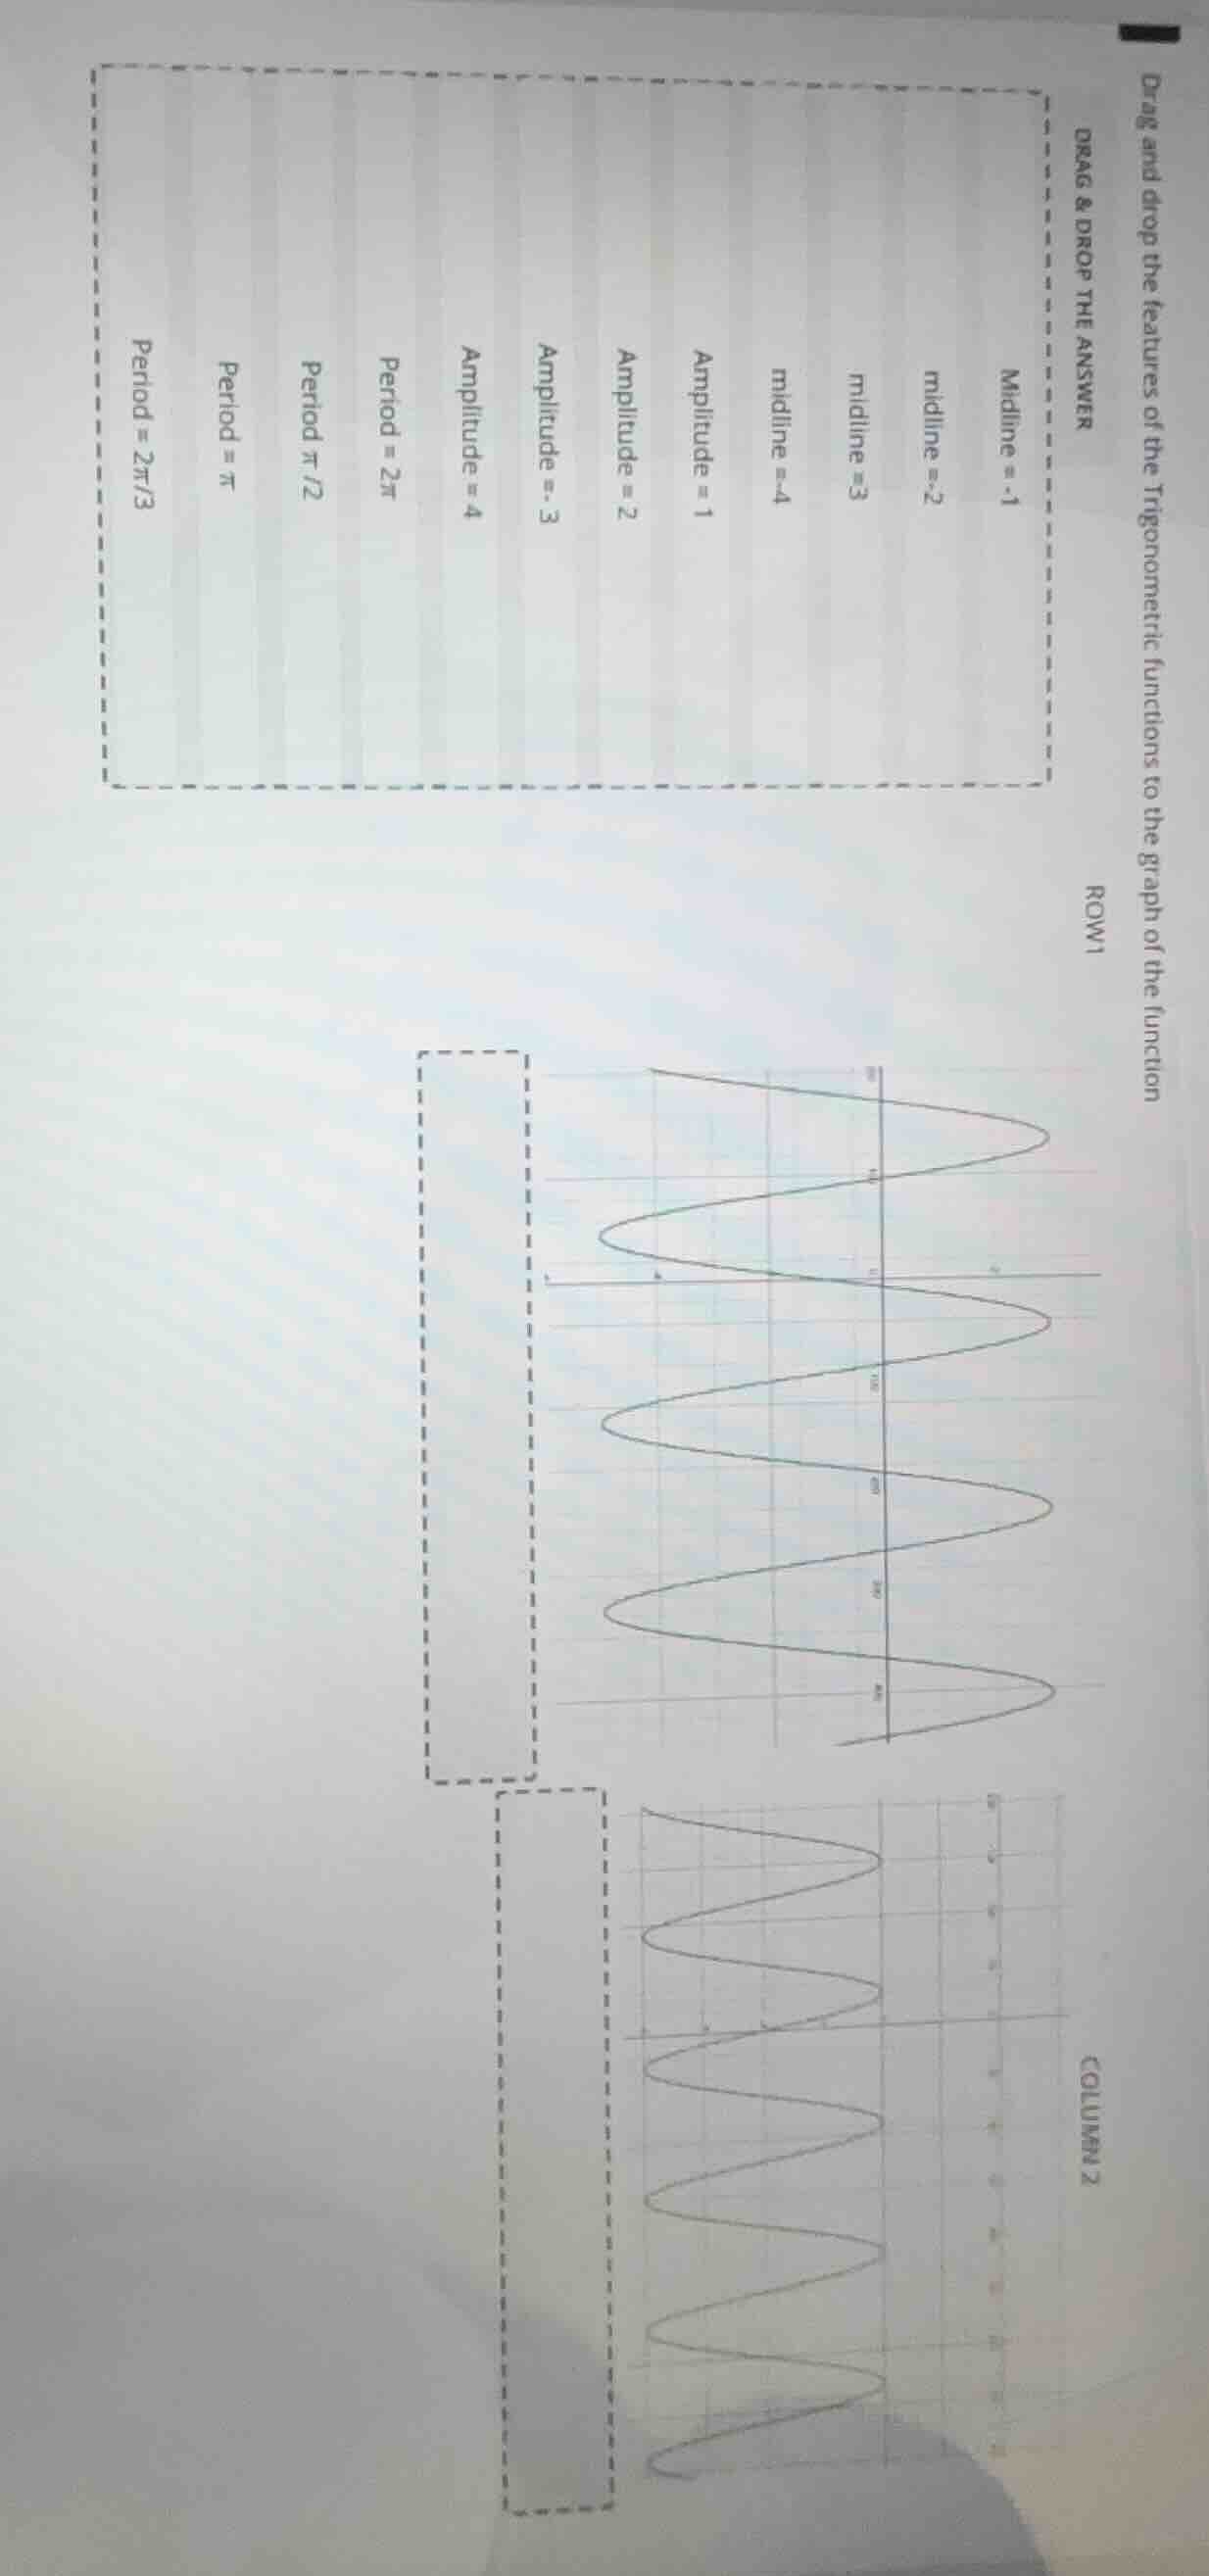
drag and drop the features of the trigonometric functions to the graph of the function
drag & drop the answer
midline = -1
midline = -2
midline = -3
midline = -4
amplitude = 1
amplitude = 2
amplitude = -3
amplitude = 4
period = 2\pi
period = \pi/2
period = \pi
period = 2\pi/3
row 1
column 2
⚡ Using what you learned: Graphing Trigonometric Functions
Step 1: Analyze the first graph (Row 1)
- Orientation: Note that the image is rotated \(90^\circ\) counterclockwise. Looking at the graph labeled "ROW 1" (the top graph when rotated correctly):
- The horizontal axis (independent variable, usually \(x\)) has grid markings.
- The vertical axis (dependent variable, usually \(y\)) has values. Let's find the maximum and minimum values of the wave:
- Maximum value: \(y = 1\)
- Minimum value: \(y = -3\)
- Midline: The horizontal line halfway between the maximum and minimum:
\[
\text{Midline} = \frac{\text{Maximum} + \text{Minimum}}{2} = \frac{1 + (-3)}{2} = -1
\]
So, the midline is \(y = -1\).
- Amplitude: The vertical distance from the midline to a peak or trough:
\[
\text{Amplitude} = \text{Maximum} - \text{Midline} = 1 - (-1) = 2
\]
- Period: The horizontal distance for one complete cycle:
- A peak occurs at \(x = 0\).
- The next peak occurs at \(x = 2\pi\).
- Therefore, the period is \(2\pi\).
Step 2: Analyze the second graph (Column 2)
- Looking at the graph labeled "COLUMN 2" (the bottom graph when rotated correctly):
- Maximum value: \(y = 1\)
- Minimum value: \(y = -7\)
- Midline:
\[
\text{Midline} = \frac{1 + (-7)}{2} = -3
\]
So, the midline is \(y = -3\).
- Amplitude:
\[
\text{Amplitude} = 1 - (-3) = 4
\]
- Period:
- A peak occurs at \(x = 0\).
- The next peak occurs at \(x = \frac{2\pi}{3}\).
- Therefore, the period is \(\frac{2\pi}{3}\).
---

Snap & solve any problem in the app
Get step-by-step solutions on Sovi AI
Photo-based solutions with guided steps
Explore more problems and detailed explanations
ROW 1 (Top Graph):
- Midline: midline = -1
- Amplitude: Amplitude = 2
- Period: Period = \(2\pi\)
COLUMN 2 (Bottom Graph):
- Midline: midline = -3
- Amplitude: Amplitude = 4
- Period: Period = \(2\pi/3\)