QUESTION IMAGE
Question
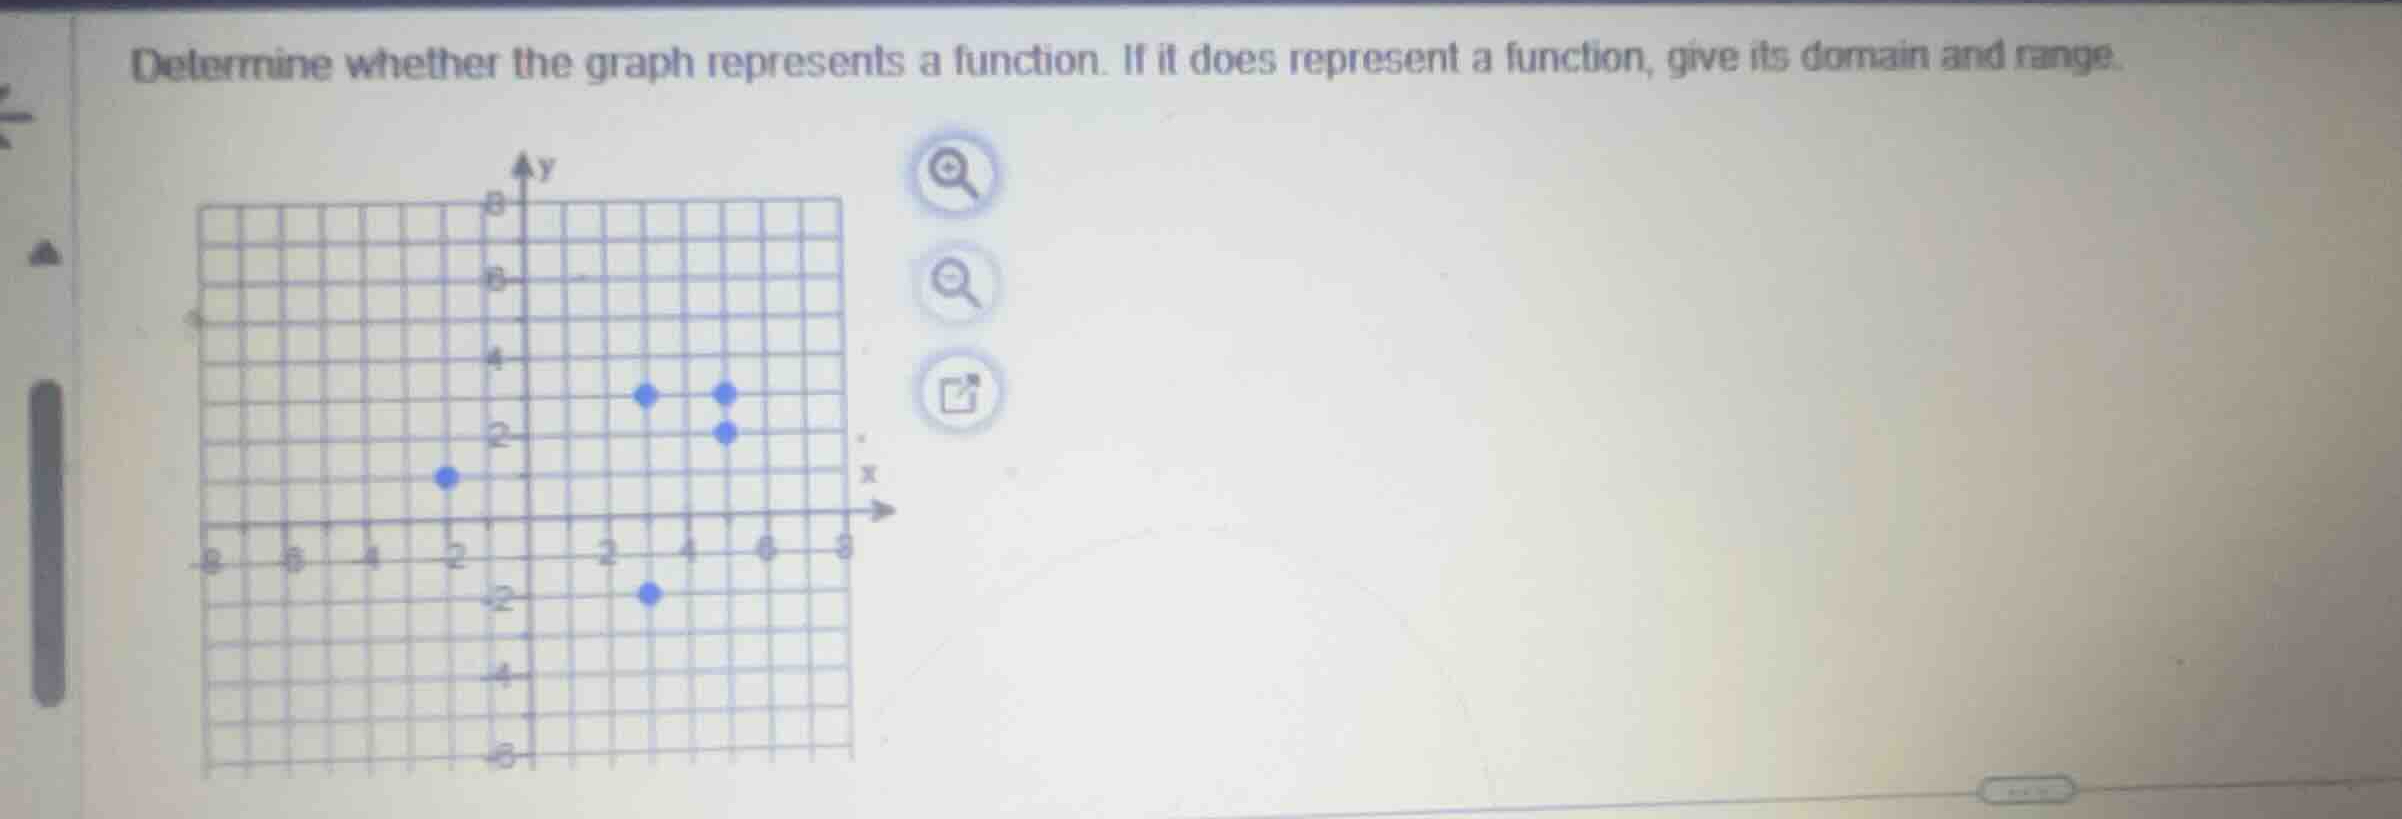
determine whether the graph represents a function. if it does represent a function, give its domain and range.
Identify the coordinates of the plotted points
$$
\{(-2, 1), (3, 3), (3, -2), (5, 2), (5, 3)\}
$$
Apply the vertical line test
$$
LATEXBLOCK0
$$
Determine if the relation is a function
$$
\text{Since vertical lines } x = 3 \text{ and } x = 5 \text{ intersect more than one point, it is not a function.}
$$

Snap & solve any problem in the app
Get step-by-step solutions on Sovi AI
Photo-based solutions with guided steps
Explore more problems and detailed explanations
The graph does not represent a function because it fails the vertical line test (the inputs \(x = 3\) and \(x = 5\) are each mapped to multiple \(y\)-values).