QUESTION IMAGE
Question
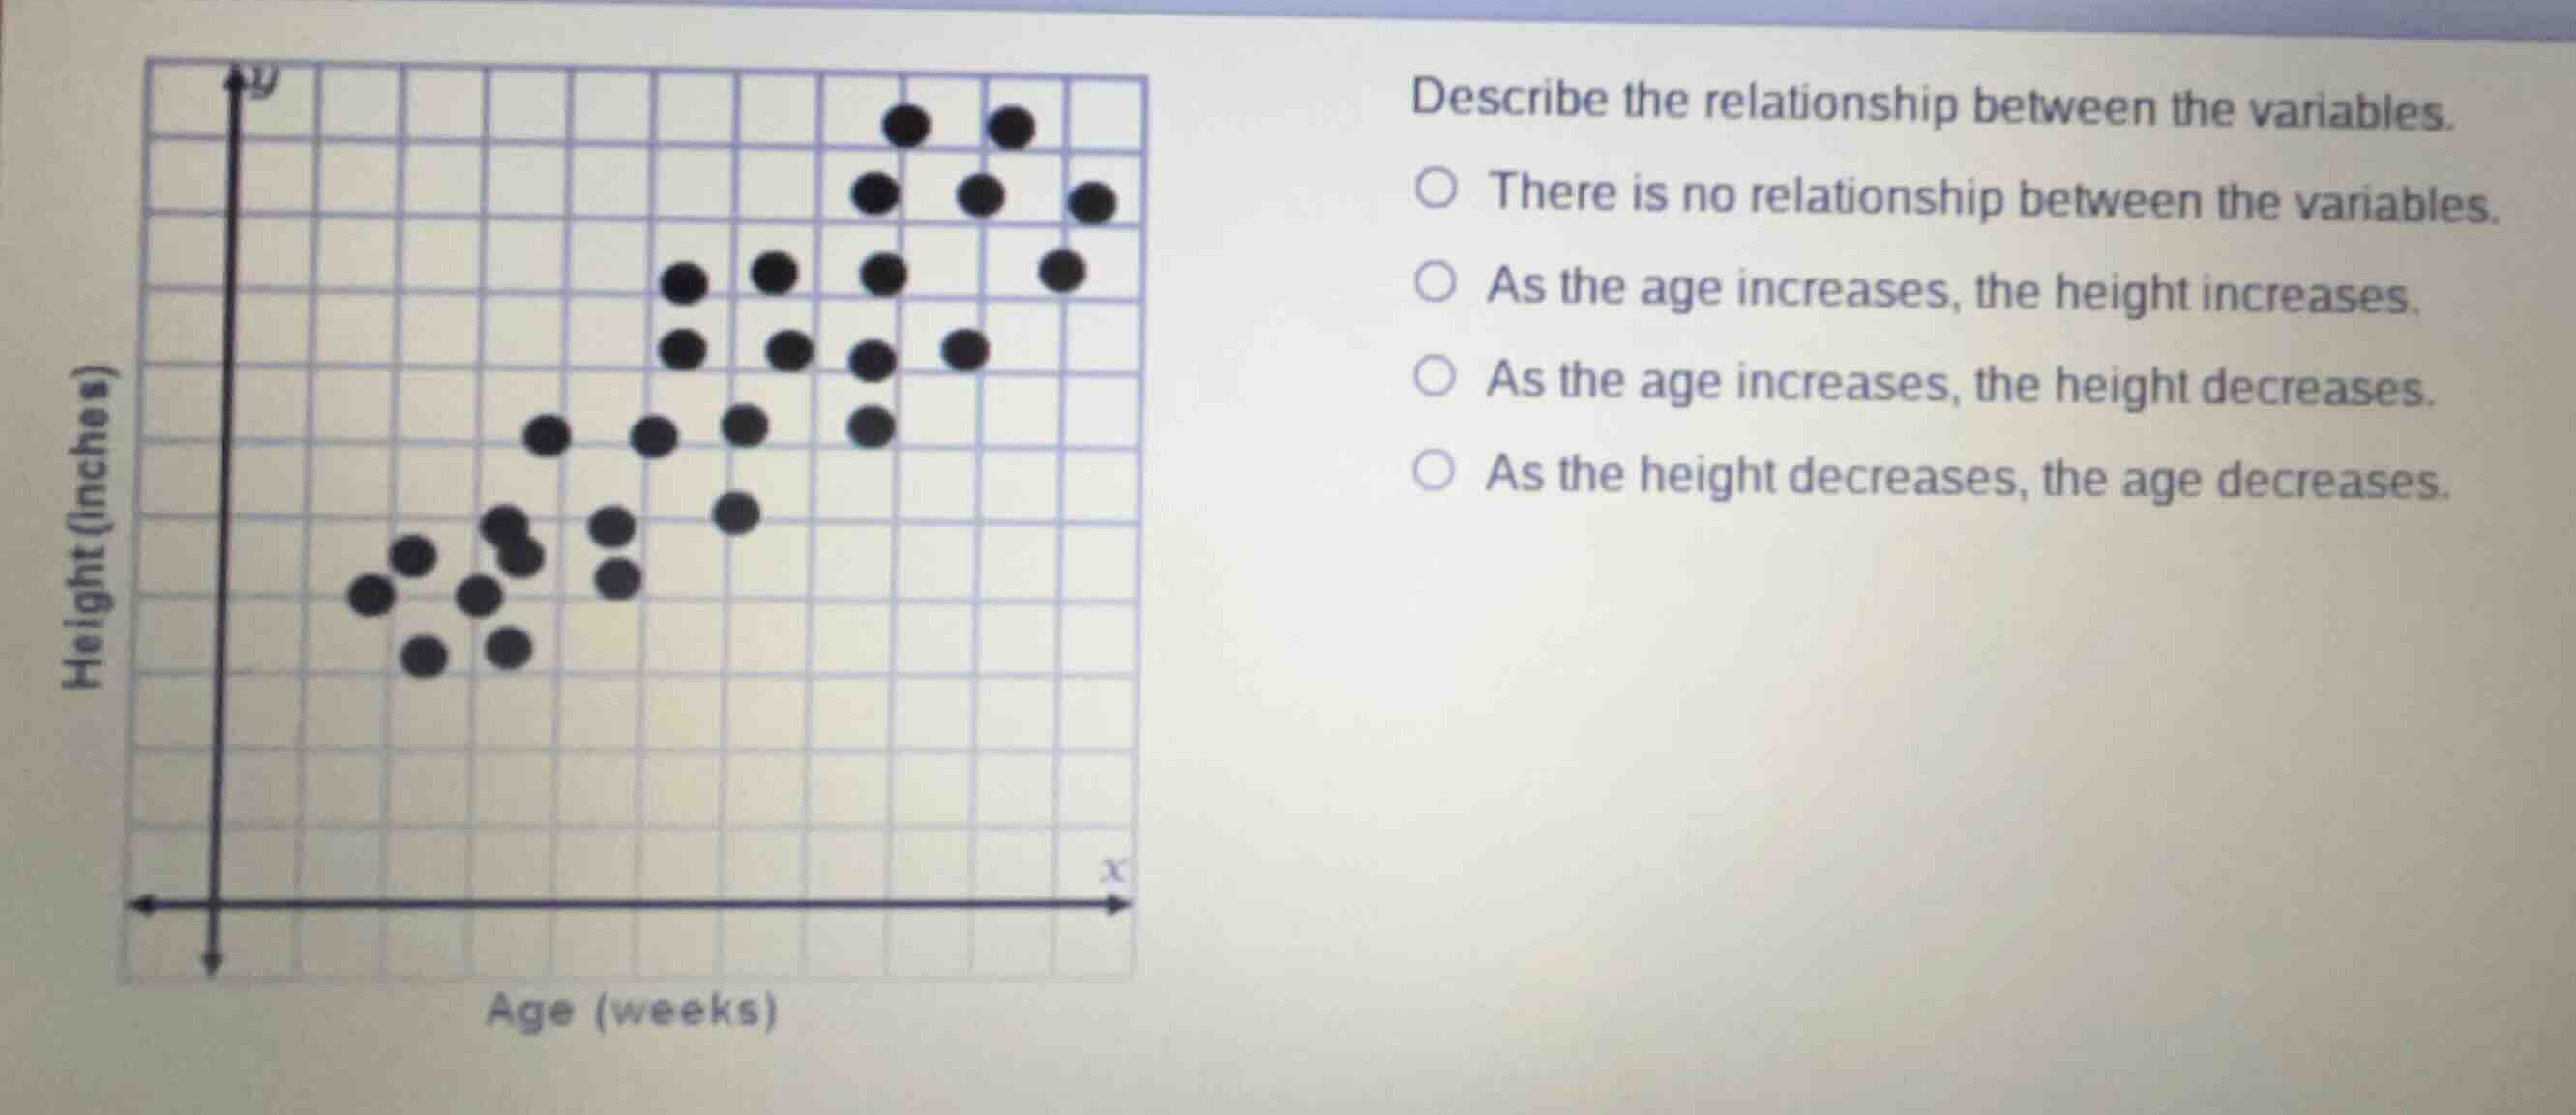
describe the relationship between the variables.
there is no relationship between the variables.
as the age increases, the height increases.
as the age increases, the height decreases.
as the height decreases, the age decreases.
Analyze the axes of the scatterplot
The horizontal axis (\(x\)-axis) represents "Age (weeks)" and the vertical axis (\(y\)-axis) represents "Height (inches)".
Determine the trend of the data points
As we move from left to right along the \(x\)-axis (as age increases), the data points generally trend upward along the \(y\)-axis (height increases). This indicates a positive correlation.
Match the trend to the given options
The upward trend corresponds to the statement: "As the age increases, the height increases."

Snap & solve any problem in the app
Get step-by-step solutions on Sovi AI
Photo-based solutions with guided steps
Explore more problems and detailed explanations
- There is no relationship between the variables.
- As the age increases, the height increases. (Correct answer)
- As the age increases, the height decreases.
- As the height decreases, the age decreases.