QUESTION IMAGE
Question
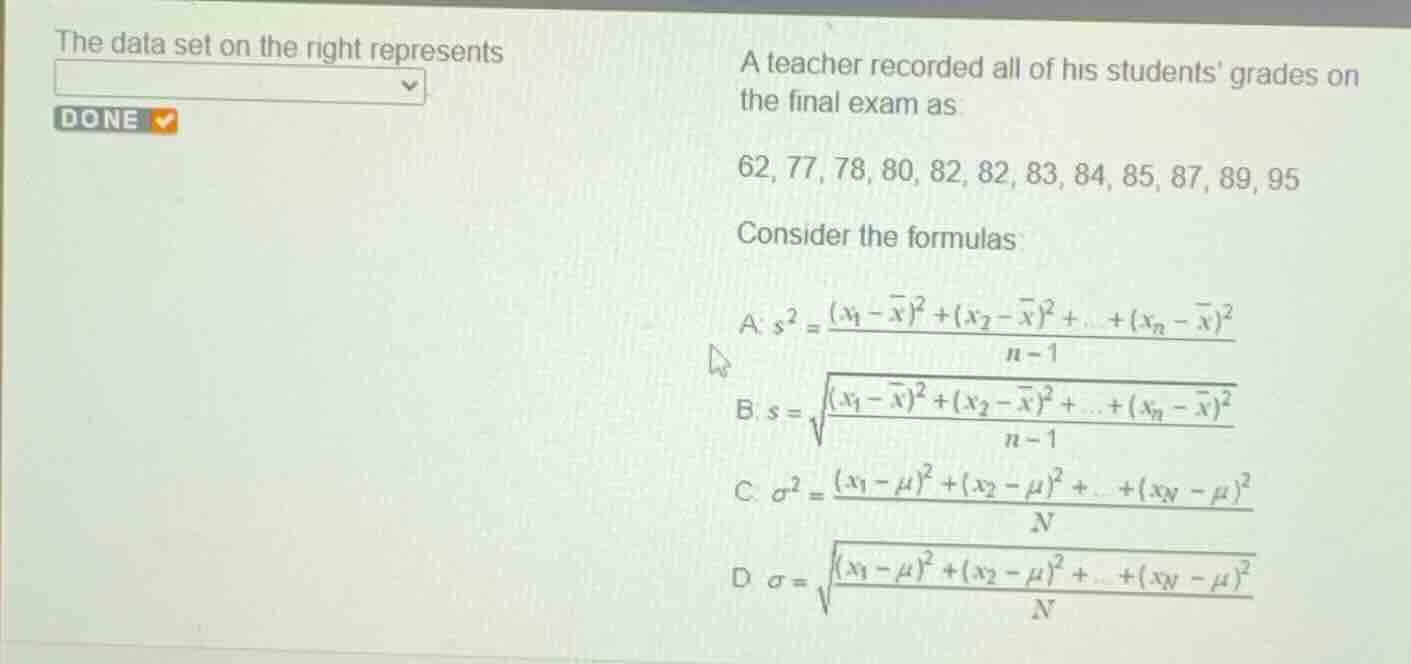
the data set on the right represents
a teacher recorded all of his students grades on the final exam as:
62, 77, 78, 80, 82, 82, 83, 84, 85, 87, 89, 95
consider the formulas:
a: \\(s^2 = \frac{(x_1 - \bar{x})^2 + (x_2 - \bar{x})^2 + \dots + (x_n - \bar{x})^2}{n-1}\\)
b: \\(s = \sqrt{\frac{(x_1 - \bar{x})^2 + (x_2 - \bar{x})^2 + \dots + (x_n - \bar{x})^2}{n-1}}\\)
c: \\(\sigma^2 = \frac{(x_1 - \mu)^2 + (x_2 - \mu)^2 + \dots + (x_n - \mu)^2}{n}\\)
d: \\(\sigma = \sqrt{\frac{(x_1 - \mu)^2 + (x_2 - \mu)^2 + \dots + (x_n - \mu)^2}{n}}\\)
Identify the scope of the data set
Using the Sample vs Population knowledge point
The problem states: "A teacher recorded all of his students' grades on the final exam." Because the data set contains the grades of every single student in the class (the entire group of interest), it represents the entire population of that class, rather than a sample.
Determine the correct classification
Using the Sample vs Population and Population Mean Symbol knowledge points
Since the data set includes every member of the group being studied, it is classified as a population. Therefore, the dropdown menu should be filled with "a population".

Snap & solve any problem in the app
Get step-by-step solutions on Sovi AI
Photo-based solutions with guided steps
Explore more problems and detailed explanations
The data set on the right represents <blank>a population</blank>