QUESTION IMAGE
Question
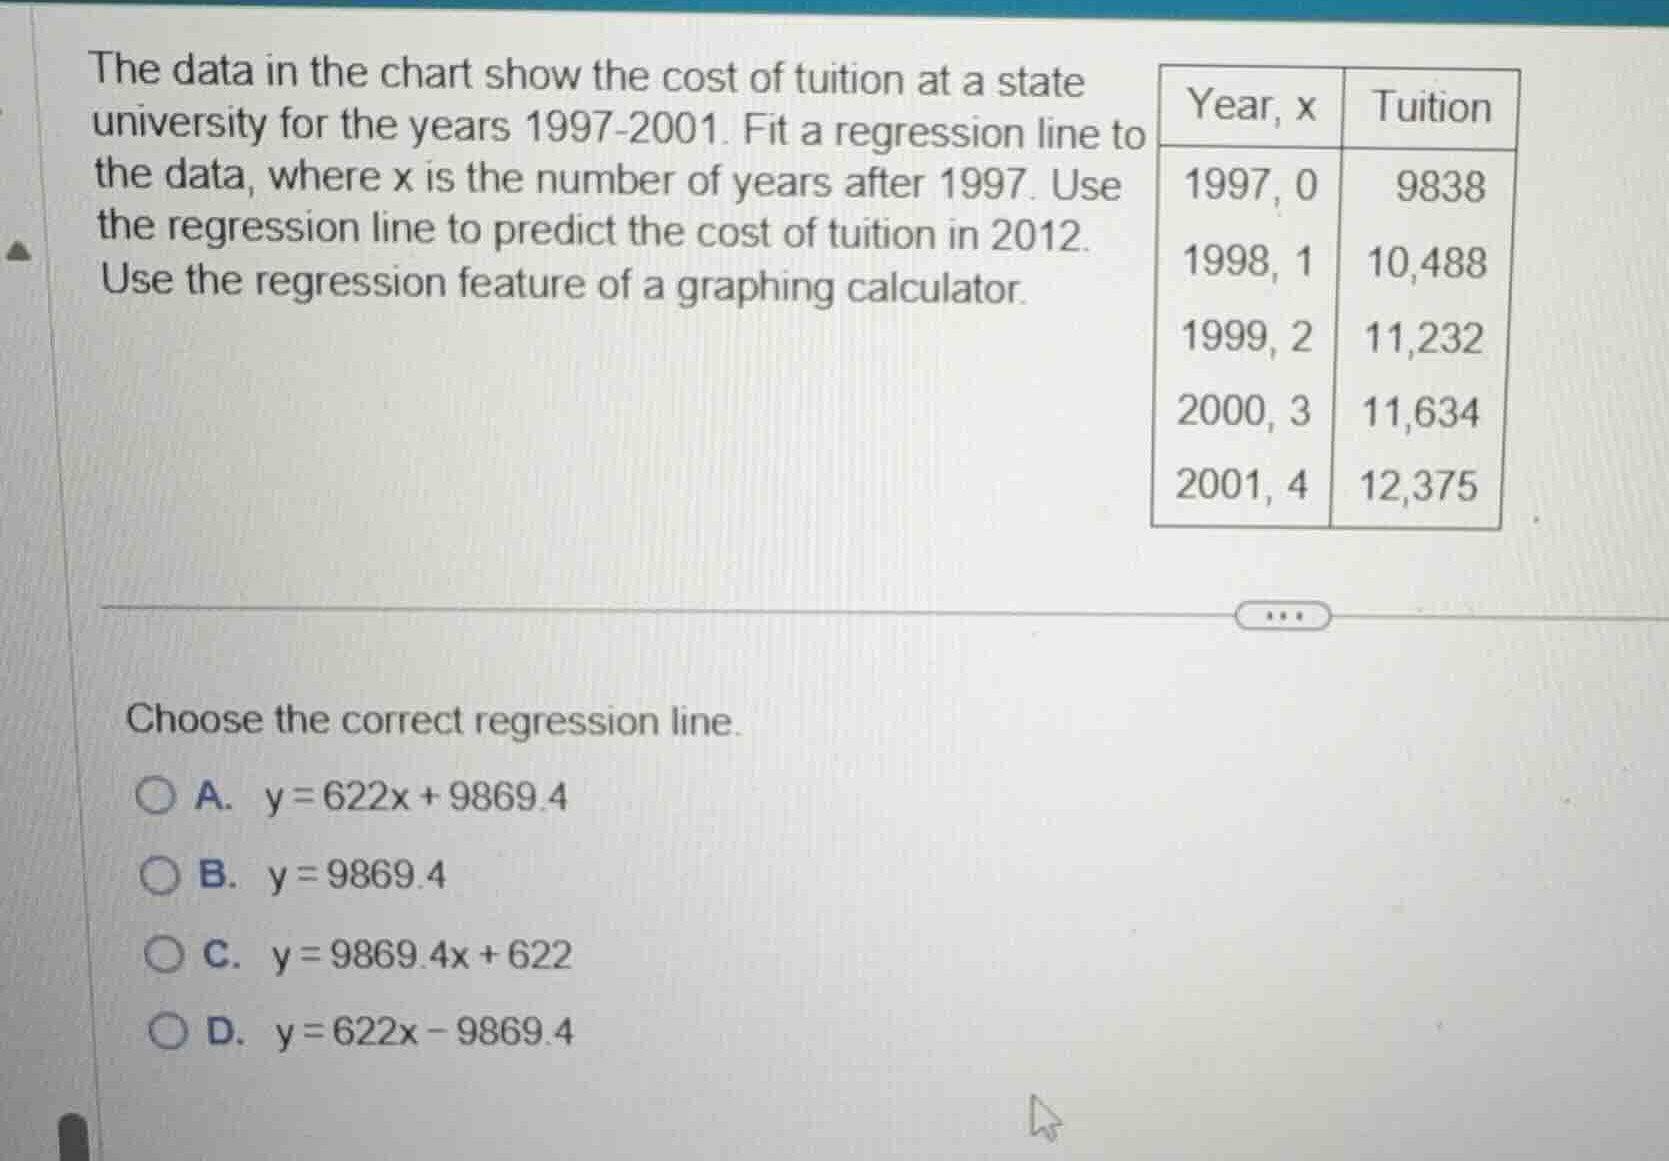
the data in the chart show the cost of tuition at a state university for the years 1997-2001. fit a regression line to the data, where x is the number of years after 1997. use the regression line to predict the cost of tuition in 2012. use the regression feature of a graphing calculator.
choose the correct regression line.
a. \\(y = 622x + 9869.4\\)
b. \\(y = 9869.4\\)
c. \\(y = 9869.4x + 622\\)
d. \\(y = 622x - 9869.4\\)
Define the variables and data points
Using the Linear Models knowledge point
Calculate the summary statistics
Using the Linear Equations knowledge point
Compute the slope of the regression line
Using the Linear Models knowledge point
Compute the y-intercept of the regression line
Using the Linear Equations knowledge point
Match with the closest option
We compare our calculated line \(y = 626.4x + 9860.6\) with the choices:
- Option A: \(y = 622x + 9869.4\) is the closest match, representing the standard linear regression model.

Snap & solve any problem in the app
Get step-by-step solutions on Sovi AI
Photo-based solutions with guided steps
Explore more problems and detailed explanations
- (A) \(y = 622x + 9869.4\) (Correct answer)
- (B) \(y = 9869.4\)
- (C) \(y = 9869.4x + 622\)
- (D) \(y = 622x - 9869.4\)