QUESTION IMAGE
Question
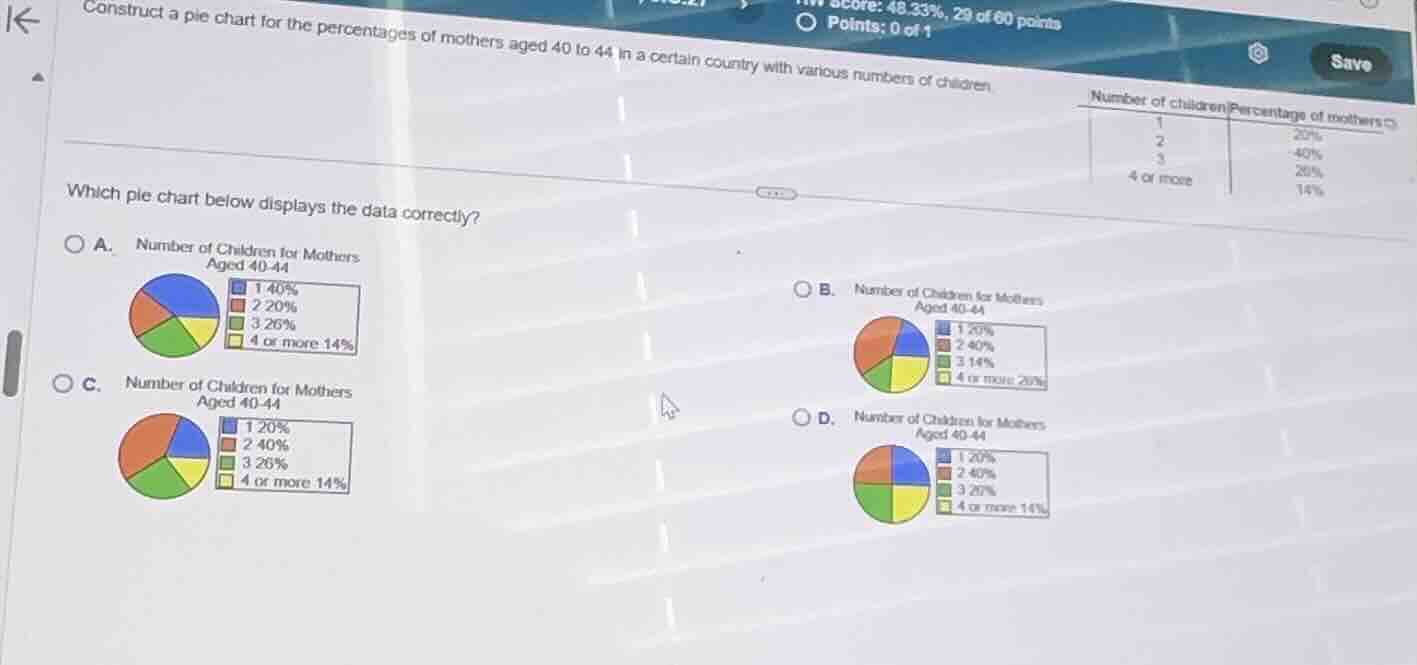
construct a pie chart for the percentages of mothers aged 40 to 44 in a certain country with various numbers of children.
\
which pie chart below displays the data correctly?
a. number of children for mothers aged 40-44
b. number of children for mothers aged 40-44
c. number of children for mothers aged 40-44
d. number of children for mothers aged 40-44
Analyze the given data table
Using the Percentage Calculation knowledge point
The table in the upper right corner lists the percentages of mothers aged 40 to 44 with various numbers of children:
- 1 child: \(26\%\)
- 2 children: \(40\%\)
- 3 children: \(20\%\)
- 4 or more children: \(14\%\)
Evaluate the options based on the data
Using the Bar Graph Construction knowledge point
We compare the percentages in the table to the legends of the pie charts:
- Option A: 1: \(40\%\), 2: \(20\%\), 3: \(26\%\), 4 or more: \(14\%\) (Incorrect)
- Option B: 1: \(20\%\), 2: \(40\%\), 3: \(14\%\), 4 or more: \(20\%\) (Incorrect)
- Option C: 1: \(20\%\), 2: \(40\%\), 3: \(26\%\), 4 or more: \(14\%\) (Incorrect)
- Option D: 1: \(26\%\), 2: \(40\%\), 3: \(20\%\), 4 or more: \(14\%\) (Correct)
Verify the visual representation of Option D
Using the Pie Chart Interpretation knowledge point
In Option D, the sectors correspond to:
- 1 child (blue): \(26\%\) (about a quarter of the circle)
- 2 children (orange): \(40\%\) (the largest sector)
- 3 children (green): \(20\%\) (one-fifth of the circle)
- 4 or more children (yellow): \(14\%\) (the smallest sector)
This perfectly matches both the numerical values and their relative visual proportions.

Snap & solve any problem in the app
Get step-by-step solutions on Sovi AI
Photo-based solutions with guided steps
Explore more problems and detailed explanations
- (A) Legend: 1: 40%, 2: 20%, 3: 26%, 4 or more: 14%
- (B) Legend: 1: 20%, 2: 40%, 3: 14%, 4 or more: 20%
- (C) Legend: 1: 20%, 2: 40%, 3: 26%, 4 or more: 14%
- (D) Legend: 1: 26%, 2: 40%, 3: 20%, 4 or more: 14% (Correct answer)