QUESTION IMAGE
Question
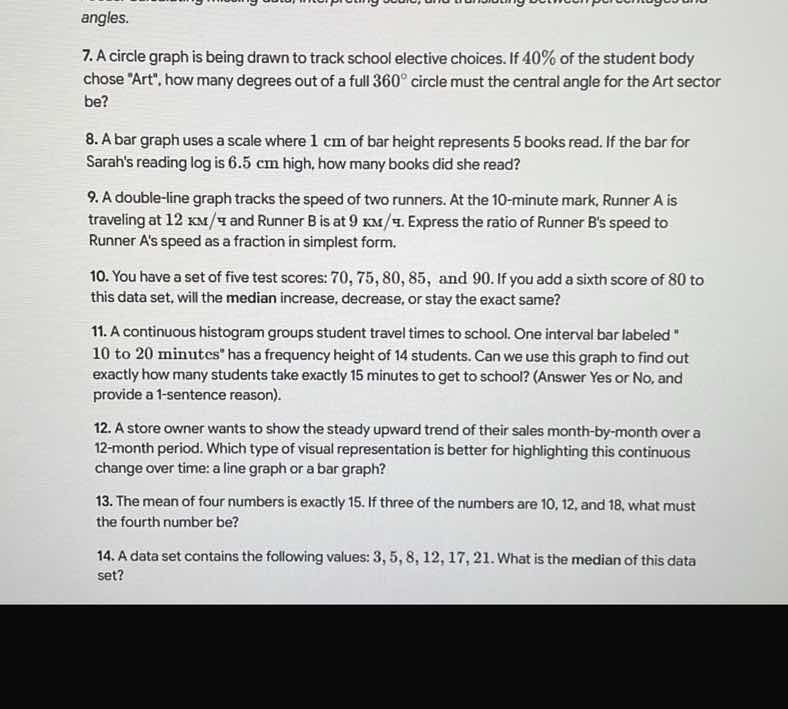
- a circle graph is being drawn to track school elective choices. if \\(40\\%\\) of the student body chose \art\, how many degrees out of a full \\(360^\circ\\) circle must the central angle for the art sector be?
- a bar graph uses a scale where \\(1\text{ cm}\\) of bar height represents \\(5\\) books read. if the bar for sarahs reading log is \\(6.5\text{ cm}\\) high, how many books did she read?
- a double-line graph tracks the speed of two runners. at the 10-minute mark, runner a is traveling at \\(12\text{ km/h}\\) and runner b is at \\(9\text{ km/h}\\). express the ratio of runner bs speed to runner as speed as a fraction in simplest form.
- you have a set of five test scores: \\(70, 75, 80, 85,\\) and \\(90\\). if you add a sixth score of \\(80\\) to this data set, will the median increase, decrease, or stay the exact same?
- a continuous histogram groups student travel times to school. one interval bar labeled \10 to 20 minutes\ has a frequency height of \\(14\\) students. can we use this graph to find out exactly how many students take exactly \\(15\\) minutes to get to school? (answer yes or no, and provide a 1-sentence reason).
- a store owner wants to show the steady upward trend of their sales month-by-month over a 12-month period. which type of visual representation is better for highlighting this continuous change over time: a line graph or a bar graph?
- the mean of four numbers is exactly \\(15\\). if three of the numbers are \\(10, 12,\\) and \\(18\\), what must the fourth number be?
- a data set contains the following values: \\(3, 5, 8, 12, 17, 21\\). what is the median of this data set?
Question 7: Calculate central angle for Art sector
$$
360^\circ \times 0.40 = 144^\circ
$$
Question 8: Calculate total books read
$$
6.5 \text{ cm} \times 5 \text{ books/cm} = 32.5 \text{ books}
$$
Question 9: Express ratio of Runner B to Runner A
$$
\frac{\text{Runner B}}{\text{Runner A}} = \frac{9}{12} = \frac{3}{4}
$$
Question 10: Determine median change
$$
LATEXBLOCK0
$$
Question 11: Analyze histogram interval data
$$
\text{No. Histograms show interval frequencies, not individual data values.}
$$
Question 12: Select graph type for continuous change
$$
\text{Line graph}
$$
Question 13: Solve for the fourth number
$$
LATEXBLOCK1
$$
Question 14: Find the median of the data set
$$
LATEXBLOCK2
$$

Snap & solve any problem in the app
Get step-by-step solutions on Sovi AI
Photo-based solutions with guided steps
Explore more problems and detailed explanations
Question 7
\(144^\circ\)
Question 8
\(32.5\) books
Question 9
\(\frac{3}{4}\)
Question 10
Stay the exact same
Question 11
No, because a histogram only shows the total number of data points within an interval, not the specific individual values.
Question 12
A line graph
Question 13
\(20\)
Question 14
\(10\)